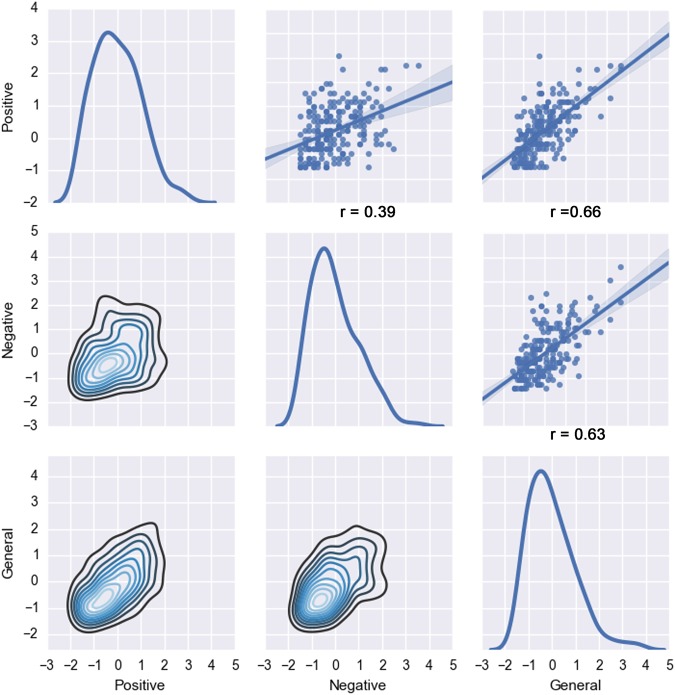
Fig. 1. Distribution of questionnaire responses by PANSS categories.
In the examined schizophrenia patients, the item scores were summarized by the positive, negative, and general symptom groups structuring the questionnaire. That is, we plotted the standardized items scores mean of each symptom group (positive, negative, and general). Diagonal: the curves represent the individual distribution of the positive, negative and general symptoms items scores. Top-right: the three scatter plots display the linear dependencies between the positive and the negative, the positive and the general, and the general and the negative symptoms items scores and the linear regression of the data sample (with the correlation coefficient r noted below). Lower-left: plots the density estimates between each variable. Item responses were z-scored to put them on a same par for comparability

