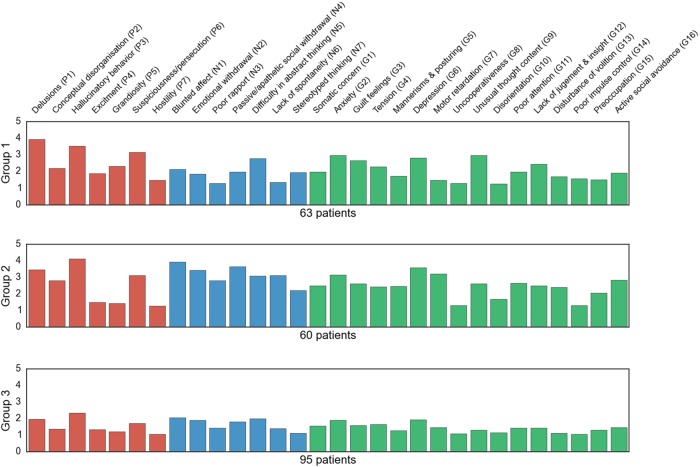
Fig. 2. Three patient groups with distinct symptom profiles.
Three patient groups were extracted from the data using automatic clustering. Each row represents one data-derived symptom group with a distinct profile of patients. The weights (x axis) of each bar (PANSS item on the y axis) are automatically determined given the relative importance of the items for a particular group. The red bars are the item scores of the PANSS positive scale in the respective cluster, the blue ones are the item scores of the PANSS negative scale and the green bars are the item scores of the PANSS general psychopathology scale. Three different subtypes appeared: a profile including patients with low score for each item (group 3), a profile including patients with very high scores on a number of items related to each type of symptomatology (i.e., negative, positive, and general symptoms, group 1) and a profile including patients scoring very high on items associated with negative symptoms (group 2). In sum, these results suggest a discriminative hidden structure in the PANSS items not only based on a dimensional but also on a categorical aspect of the PANSS

