
Figure 8.
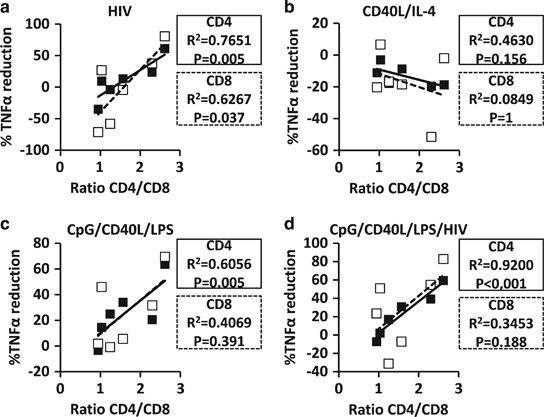
Reduction of TNFα expression in CD4+ or CD8+ T cells after co-culture with HIV-1-exposed B cells. Intracellular expression of TNFα by CD4+ and CD8+ T cells was analyzed after co-culture of effector cells (EC) and non-treated (NT) or treated B cells (ratio Breg:EC=2:1). Correlation between the ratio of CD4/CD8 and the percentage of reduction in TNFα expression in co-culture experiments when (a) HIV-1NL4-3-exposed, (b) CD40L/IL-4-exposed, (c) CpG/CD40L/LPS-exposed and (d) CpG/CD40L/LPS/HIV-1NL4-3-exposed B cells were calculated considering the mock-treated B-cell co-culture as the baseline reference level. Black squares and solid lines represent the results from CD4+ T cells, and open squares and dotted black lines represent the results from CD8+ T cells. Each square represents one experiment.