
Figure 2.
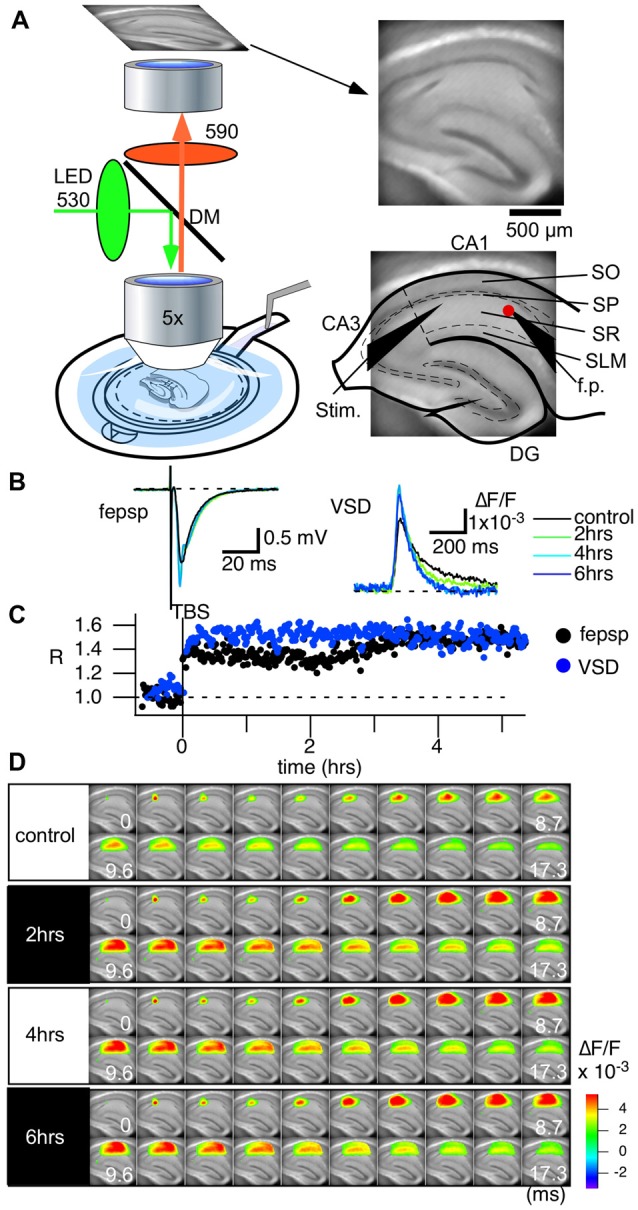
Voltage-sensitive dye (VSD) imaging can follow the long-term circuit activity changes of hippocampal slices caused by theta-burst stimulation (TBS). (A) An illustration showing the recording setup of the optical recording system. A membrane filter attached to a thin plastic ring holds a slice preparation. The ring is then held in place with a recording chamber, in which adequate ACSF is provided from the bottom of the experimental chamber and flows over the slice towards the outlet tubing. A water immersion objective lens (5× Olympus, NA 0.35) of a tandem-lens configured epifluorescent optics unit is placed above the slice preparation. An imaging device (MiCAM Ultima and MiCAM02, Brainvision Inc., Tokyo, Japan) captures the fluorescent images of the slice (right). The configuration of the electrodes (Stim., the stimulation electrode; f.p., the field potential electrode) and an illustration of the hippocampus are superimposed. Abbreviations: SO, stratum oriens-alveus; SP, stratum pyramidale; SR, stratum radiatum; SLM, stratum lacunosum-moleculare. (B) Traces of field excitatory postsynaptic potentials (fEPSPs) recorded with the field electrode before and after TBS-induced long-term potentiation (LTP) and the optical signal at the corresponding pixel. Both traces are average of eight traces. (C) Time course of LTP with the fEPSP slope (black) and the optical signal (blue) at the tip of the field potential electrode. (D) The panel shows consecutive images of the response for the control recording and for recordings made at 2 h, 4 h and 6 h. We recorded the optical signals every 60 s at a frame rate of 0.1 ms/frame.