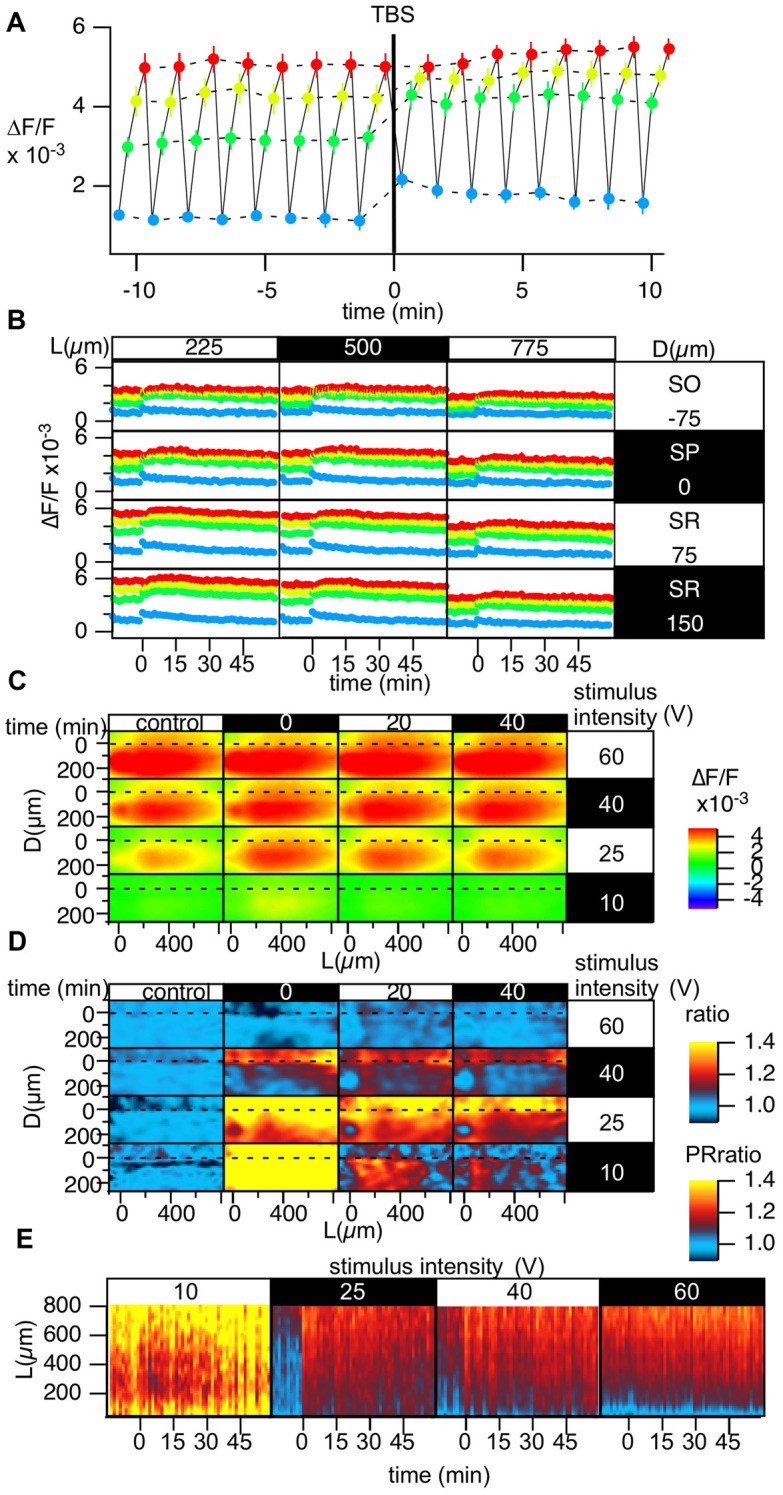
Figure 6.

Grouped data of the change in the stimulus-response relationship caused by TBS. (A) Change in the optically measured stimulus-response relationship measured by altering the stimulus intensity in four steps c[10 (blue), 25 (green), 40 (yellow) and 60 V (red)] every 20 s while performing optical recording in a time-window containing the induction of LTP in a representative point. (B) The time courses of the optical response at the representative points in the D-L coordinates while changing the stimulus intensity; the colors of the points correspond to the stimulus intensity [10 (blue), 25 (green), 40 (yellow), and 60 V (red)]. (C) The peak of the optical signals mapped in D-L coordinate at different stimulus intensity and different time. (D) The degree of LTP in the D-L coordinate plane corresponding to the stimulus intensity. (E) Time change in the PRR for each stimulus intensity. N = 2, n = 10, bars in (A,B) indicate SEM.
