
FIGURE 1.
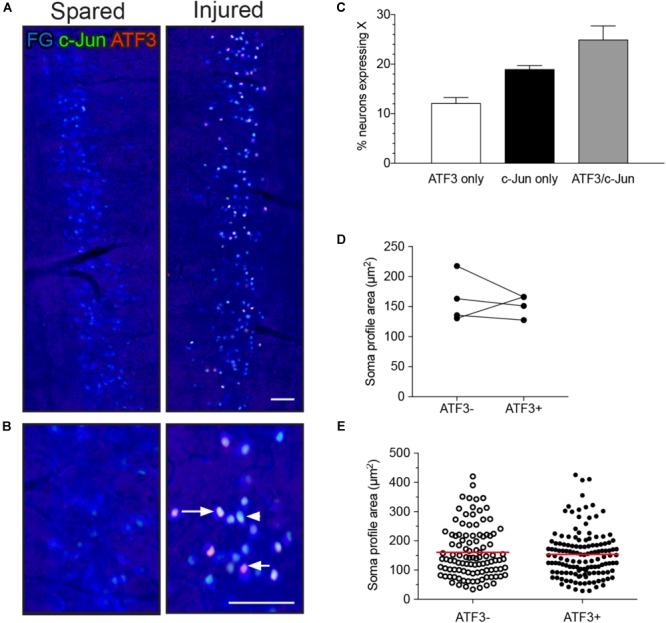
Expression of ATF3 and c-Jun in L6-S1 preganglionic neurons one week after unilateral transection of the pelvic nerve. Representative horizontal sections of spinal cord were immunolabeled for c-Jun (green) and ATF3 (red). Preganglionic neurons were identified by their uptake of retrograde tracer [FluoroGold (FG), here colorized blue]. Because all of the preganglionic neurons are quite intensely labeled by FluoroGold (shown as blue), the c-Jun nuclei appear turquoise rather than green and the ATF3 nuclei appear pink rather than red. Images are oriented with rostral at the top and lateral on the left (spared) or right (injured) of the relevant panel. (A) Contralateral to the injury (“spared”), no preganglionic neurons were immunoreactive for ATF3 and rare nuclei were immunoreactive for c-Jun; in contrast, ipsilateral to injury (“injured”) many preganglionic neurons were immunoreactive for ATF3, c-Jun, or both transcription factors (ATF3/c-Jun). An example of each is shown by an arrowhead (c-Jun), short arrow (ATF3), and long arrow (ATF3/c-Jun). (B) Higher magnification of spared (left) and injured (right) sides of the L6-S1 IML. (C) Quantitation of FG-positive preganglionic neurons ipsilateral to injury, showing the proportion that are immunoreactive for either ATF3 or c-Jun alone, or for both transcription factors (ATF3/c-Jun); together these comprise 56.1 ± 2.8% of sacral preganglionic neurons identified by FG (n = 6). (D) No difference was identified between the soma profile areas of neurons expressing ATF3 (153 ± 9 μm2) and ATF3-negative neurons (162 ± 20 μm2). Data shown as (D) mean soma profile area from each side of each animal and (E) individual neurons pooled from all animals. n = 4 rats, minimum of 20 neurons measured on each side in each rat, two-tailed, paired t-test: P = 0.65. Calibration bars represent 100 μm.