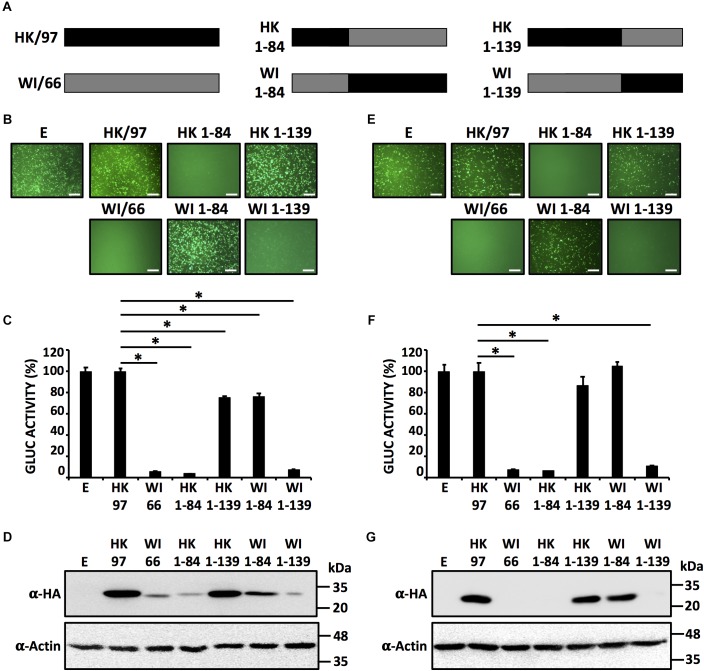
FIGURE 3.
Identification of the region in H9N2 NS1 involves in inhibition of host gene expression. (A) Schematic representation of HK/97 (black bars) and WI/66 (gray bars) WT and chimeric (HK 1-84, HK 1-139, WI 1-84 and WI 1-139) NS1 constructs. HEK293T (B–D) and DF-1 (E–G) cells were transiently co-transfected as described in Figure 1. At 24 hpt, cells were analyzed for GFP (B,E) and Gluc (C,F) expression as indicated in Figure 1. ∗P ≤ 0.0001 using One-way ANOVA. NS1 protein expression levels from total cell lysates were analyzed by Western blot (D,G) using an anti-HA (α-HA) pAb. Actin expression levels were used as an internal loading control. Molecular mass markers (in kDa) are indicated. Representative images of three independent transfections are represented. Scale bar, 200 μm (B,E). Data were represented as relative activity considering the activity of HK/97 as 100%. Data represent the mean and SDs of triplicate values (C,F). Molecular protein markers in kDa are indicated on the right of each of the Western blots (D,G). E, empty plasmid; A/guinea fowl/Hong Kong/WF10/1999 H9N2; HK/97, A/quail/Hong Kong/G1/1997 H9N2; WI/66, A/turkey/Wisconsin/1/1966 H9N2.

