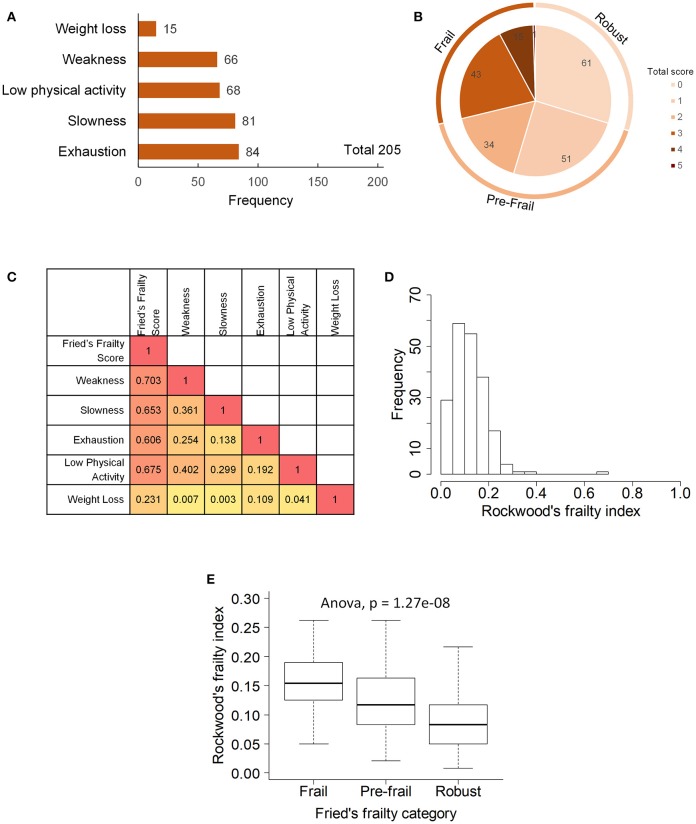
Figure 1.
Frailty phenotype in the study participants: (A) prevalence of five components of Fried's frailty, (B) distribution of Fried's frailty score and definition of frail, pre-frail and robust groups, (C) Spearman's rank correlation between frailty components, (D) distribution of Rockwood's frailty index, and (E) association between Fried's frailty groups and Rockwood's frailty index.

