
Figure 3.
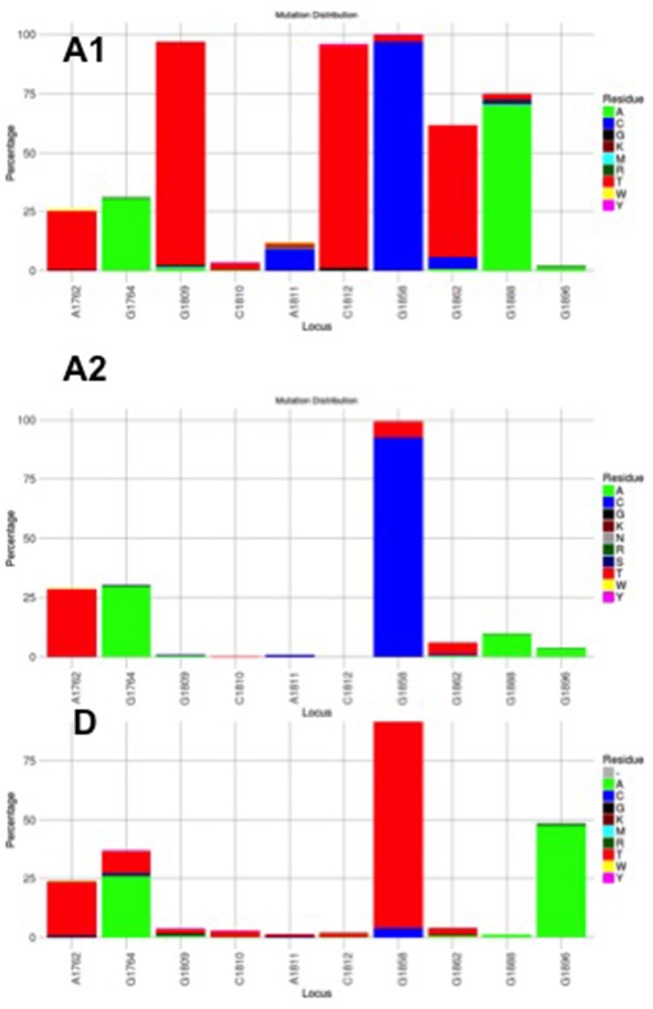
Mutation distribution graphs generated using the Mutation Reporter Tool (Bell and Kramvis, 2013) showing the percentage of mutant residues relative to the reference motif found at the ten loci of interest specified (1762, 1764, 1809-1812, 1858, 1862, 1888, 1896). Three data sets were submitted to the tool to produce the three graphs showing the mutation distribution for 605 subgenotype A1, 730 subgenotype A2 and, 1899 genotype D unselected sequences. The basic core promoter/precore sequences (1750 – 1900 from EcoR1 site) was downloaded from http://hvdr.bioinf.wits.ac.za/alignments (Bell et al., 2016). The reference motif used was AGGCACGGGG. This is also shown by the letter preceding each locus on the X-axis. To facilitate direct comparisons between the graphs, conserved loci were not suppressed and the Y-axis was scaled to 100% by selecting the appropriate controls on the input page.