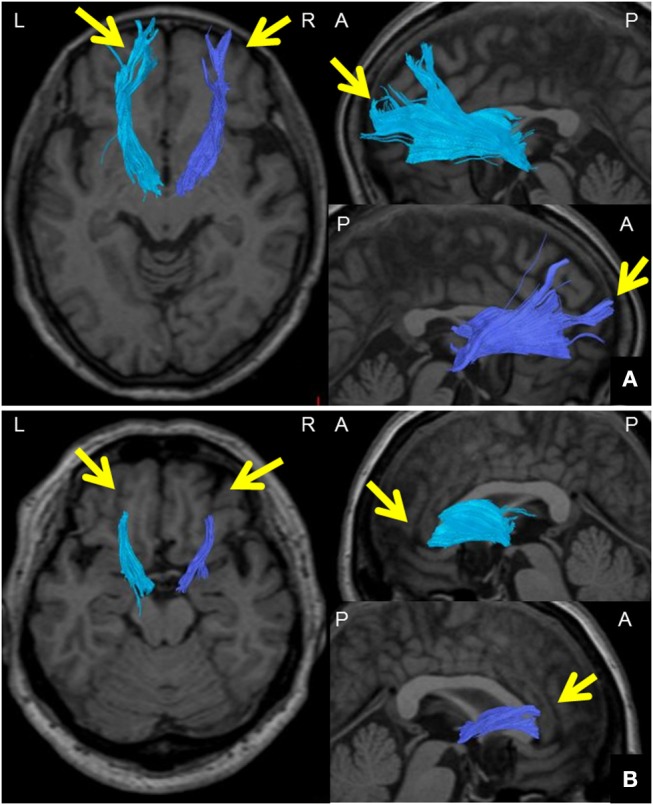
Figure 2.

Method for visually evaluating the ATR using DTT. (A) Images of the ATR in both hemispheres from a 65-year-old woman participating as an HC. DTT images were taken with a right FA threshold of 0.28 and left FA threshold of 0.26 at the termination of fiber tracking. The ATR was tracked all the way to the brain surface in both hemispheres (arrows); ATR visualization was thus categorized as “good.” (B) Images of the ATR in both hemispheres of a 57-year-old woman from the BD group. DTT images were taken with a right FA threshold of 0.28 and left FA threshold of 0.26 at the termination of fiber tracking. The ATR could not be tracked all the way to the brain surface in either hemisphere (arrows); ATR visualization was thus categorized as “poor.” DTT, diffusion tensor tractography; ATR, anterior thalamic radiation; HC, healthy controls; BD, bipolar disorder; A, anterior; P, posterior; L, left; R, right.
