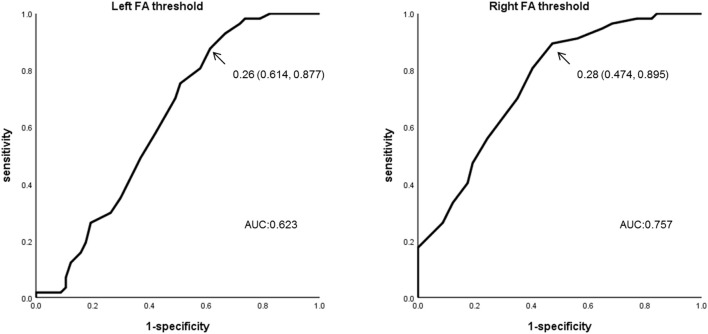
Figure 4.
ROC curve analysis using the optimal FA thresholds. FA threshold data for the ATR in both hemispheres were subjected to ROC curve analysis for the BD and HC groups. For the left ATR, sensitivity was 0.877, specificity was 0.386, and the AUR was 0.623 when the FA threshold of 0.26 was used. For the right ATR, sensitivity was 0.895, specificity was 0.526, and the AUR was 0.757 when the FA threshold of 0.28 was used. ROC, Receiver Operating Characteristic; ATR, anterior thalamic radiation; AUC, Area under the curve.

