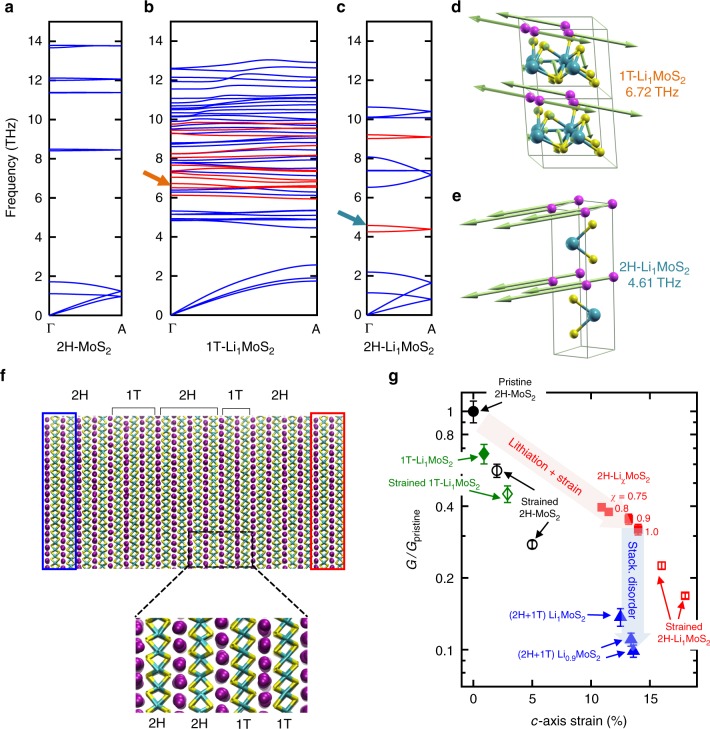
Fig. 5.
Calculated phonon dispersions along the cross-plane Г-A direction. a 2H-MoS2, b 1T-Li1MoS2, and c 2H-Li1MoS2. Phonon branches are color-coded based on whether they are MoS2-like (blue) or Li-like (red). d, e Force vectors for the modes at 6.72 THz and 4.61 THz in 1T-Li1MoS2 and 2H-Li1MoS2, respectively, showing strong vibrations of Li atoms (depicted by the magenta spheres). f Snapshot of a 10 nm thick NEMD simulation cell showing the mixed phase {4 × 2H, 3 × 1T, 4 × 2H, 2 × 1T, 4 × 2H} Li1MoS2 system, and a zoom-in of a 2H-1T phase boundary. The red and blue boxes are the hot and cold reservoirs, respectively. g NEMD calculations of the normalized cross-plane thermal conductance of a 10 nm thick MoS2 film plotted vs. % c-axis strain, relative to the pristine (unlithiated) 2H-MoS2 (shown as the solid black circle). Red solid squares refer to 2H-LiχMoS2 with χ = 0.75, 0.8, 0.9, and 1, blue solid triangles refer to mixed-phase (2H + 1T) LiχMoS2 with χ = 0.9 and 1 (layer sequences for 2H/1T stacking are provided in the main text), and the green solid diamond refers to 1T-Li1MoS2. In each of the above cases, the c-axis strain is intrinsic, i.e., built into the structure because of Li intercalation. The empty symbols—black circles, red squares, and green diamond—refer to externally strained 2H-MoS2, 2H-Li1MoS2, and 1T-Li1MoS2, respectively. Error bars represent statistical uncertainties arising from the fluctuations of the heat current and the temperature profile at stationary non-equilibrium conditions

