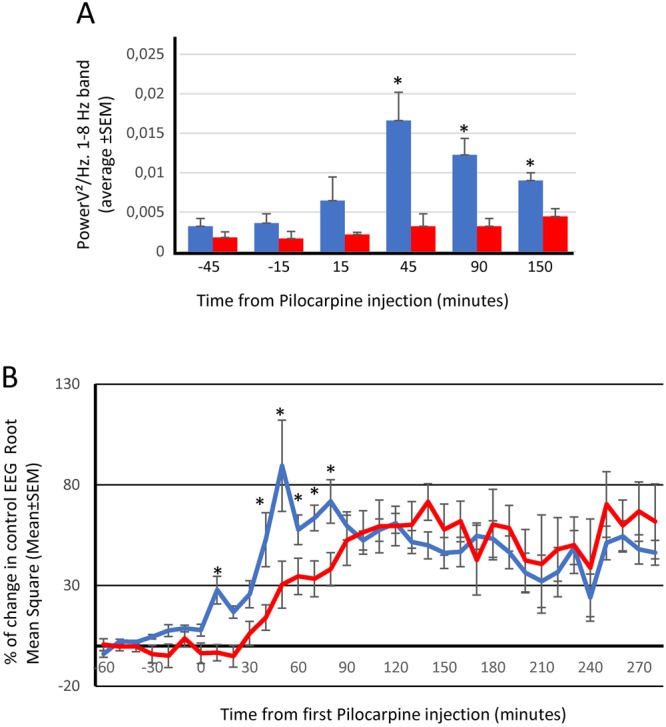
Figure 3.

Static magnetic fields prevent changes in frequency and amplitude after a Pilocarpine injection (A) Bar histogram representing the averaged potency of the EEG at 1–8 Hz band (PSD) for sham animals (blue bars) and Magnet animals (red bars) *p < 0.05, Mann-Whitney U test. (B) Percent change in the spontaneous EEG Root Mean Square (RMS). Blue line, sham rats; red line, Magnet rats. *p < 0.05, Mann-Whitney U test. In both cases (A,B), data were obtained from 30 second epochs, automatically collected from the original recording every 10 minutes, and actual values are presented in Supplementary Tables S1, S2.
