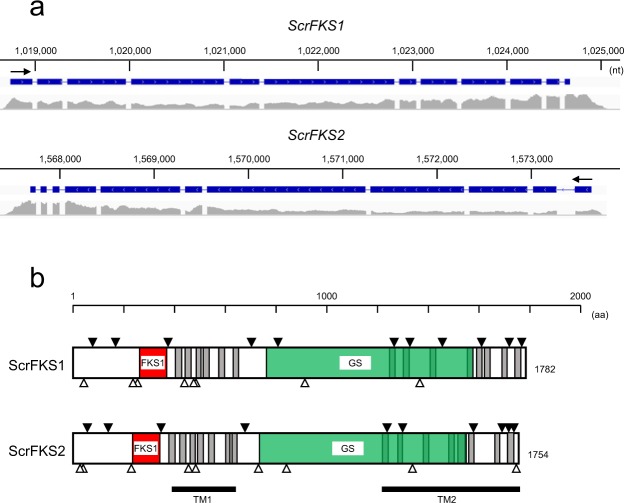
Figure 5.
Structure of β-glucan synthases. (a) Structure of ScrFKS1 (on contig 5) and ScrFKS2 (on contig 4) genes in S. crispa. The intron-exon structure is shown above, while transcriptome mapping results are shown below. Transcriptional directions are shown by arrows. (b) Structure of ScrFKS1 and ScrFKS2 proteins. The transmembrane domains predicted by TMHMM are shadowed, and their clusters are marked with TM1 and TM2. The regions homologous to FKS1 domains (FKS1) and glucan synthases (GS) predicted by Pfam are shown in orange and green, respectively. The potential N-glycosylation sites predicted by ScanProsite are shown by open triangles, and the exon-intron junctions are shown by filled triangles.

