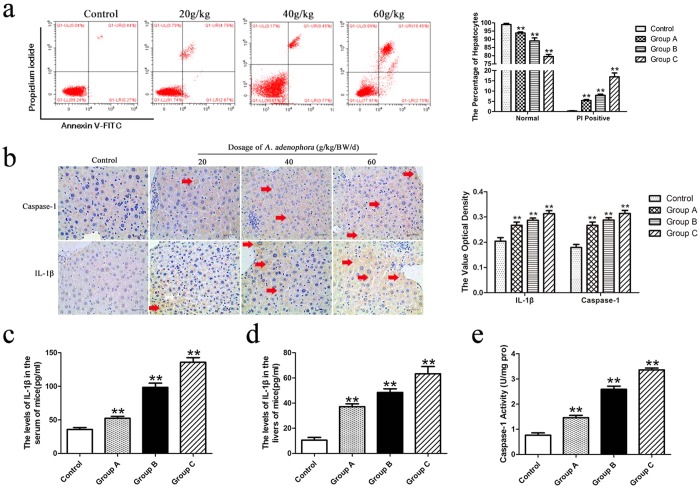
Figure 4.
A. adenophora induced in pyroptosis hepatocyte. (a) Scattergram of pyroptosis of hepatocytes. The hepatocytes were analyzed for pyroptosis through flow cytometry basing on Annexin V-FITC/PI staining. A. adenophora markedly increased PI positive cell in dose-dependent manner. (b) Caspase-1 and IL-1β expression were detected by immunohistochemistry method. The optical density values were counted by three random microscope. Magnification, 400×. Scale bar = 40 μm. The distribution of caspase-1 and IL-1β (yellow stain regions were indicated by red arrows) were increased with the increasing level of A. adenophora. ELISA was used to measured the levels of IL-1β in serum and liver homogenate (c,d). Caspase-1 activity was measuredindifferentgroups (e). The data were analyzed using Student’s t test and were considered signifcant as follows: **p < 0.01. All data are represented as mean ± SD.

