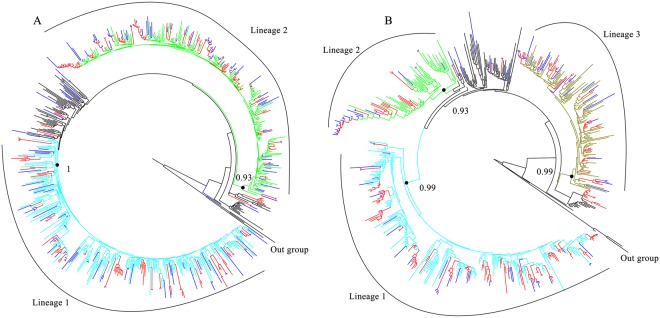
Figure 3.
Phylogenetic trees of sequences with CRF07_BC (A) and CRF01_AE (B) infection. The phylogenetic tree was constructed using the approximately-maximum-likelihood method based on the pol region (HXB2: 2, 253 to 3, 312 nt) in FastTree 2.3. The nucleotide substitution mode was GTR + G + I. Bootstrap values ≥0.9 were used to identify lineages and were indicated at all relevant nodes. Genetic transmission clusters were defined by node support thresholds ≥95% and intra-cluster maximum pairwise genetic distances <3.0% nucleotide substitutions per site. Transmission clusters were depicted in red. Blue branches represented the sequences from Guangyuan. HIV-1 subtype J (A) and C (B) were chosen as an out-group in the rooted tree.

