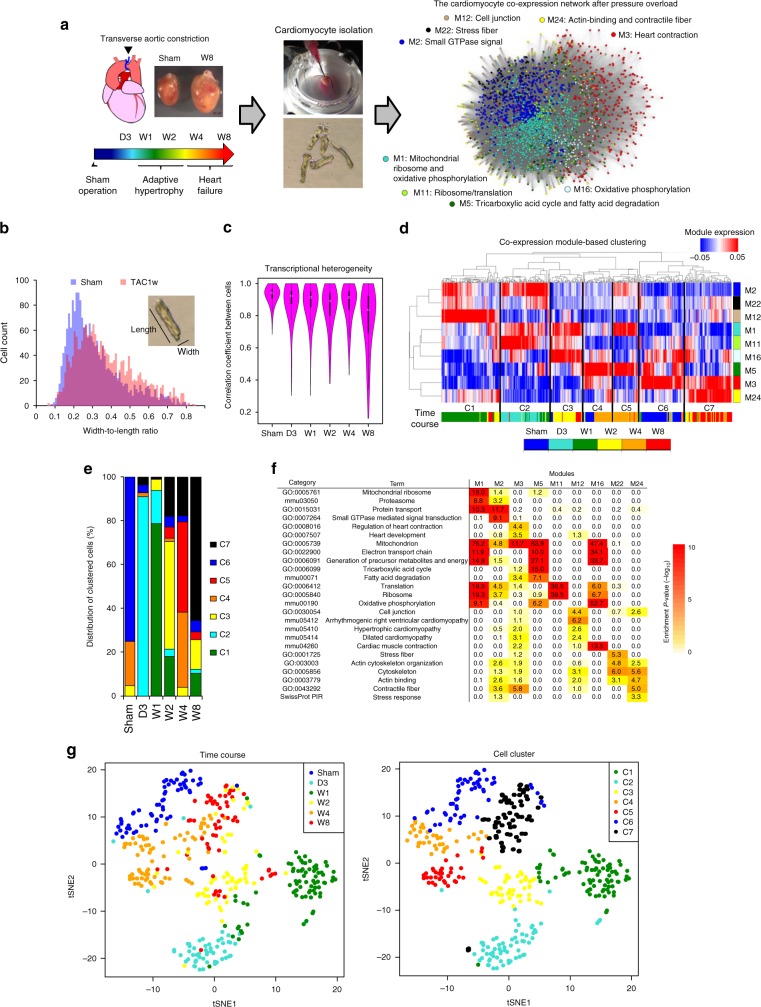
Fig. 1.
Co-expression network analysis of single-cardiomyocyte transcriptomes. a Experimental scheme to construct the co-expression network of single-cardiomyocyte transcriptomes from mice exposed to pressure overload. D3 day 3, W1 week 1, W2 week 2, W4 week 4, W8 week 8. In the network, nodes indicate genes and are positioned according to the weighted prefuse force-directed layout algorithm in Cytoscape. Edges indicate a significant correlation between genes. Length of the edges is relative to the expression similarity of the connected genes, with a short edge corresponding to a high co-expression value. Dot colors indicate module colors, matching the colors in d. b Bar plot showing the distribution of the width-to-length ratio of cells from mice after sham and transverse aorta constriction (TAC) operation (W1). c Violin plot showing the distribution of the correlation coefficients of single-cell transcriptomes among cells at each time point. d Unsupervised co-expression module-based clustering classifying all cardiomyocytes (n = 396) into seven cell clusters (C1–C7). The colored bar below the heatmap indicates the time when the cardiomyocytes were extracted; the colored bar on the right indicates module colors matching the node colors of the network in a. e Bar plot showing the distribution of clustered cells at each time point. f Heatmap showing the enrichment of gene ontology (GO) and Kyoto Encyclopedia of Genes and Genomes (KEGG) pathway terms in each module. g t-Distributed stochastic neighbor embedding (t-SNE) visualization of cardiomyocytes clustered in d. Cells (dots) are colored by the time when cardiomyocytes were extracted (left) and according to the cell clusters in d (right)

