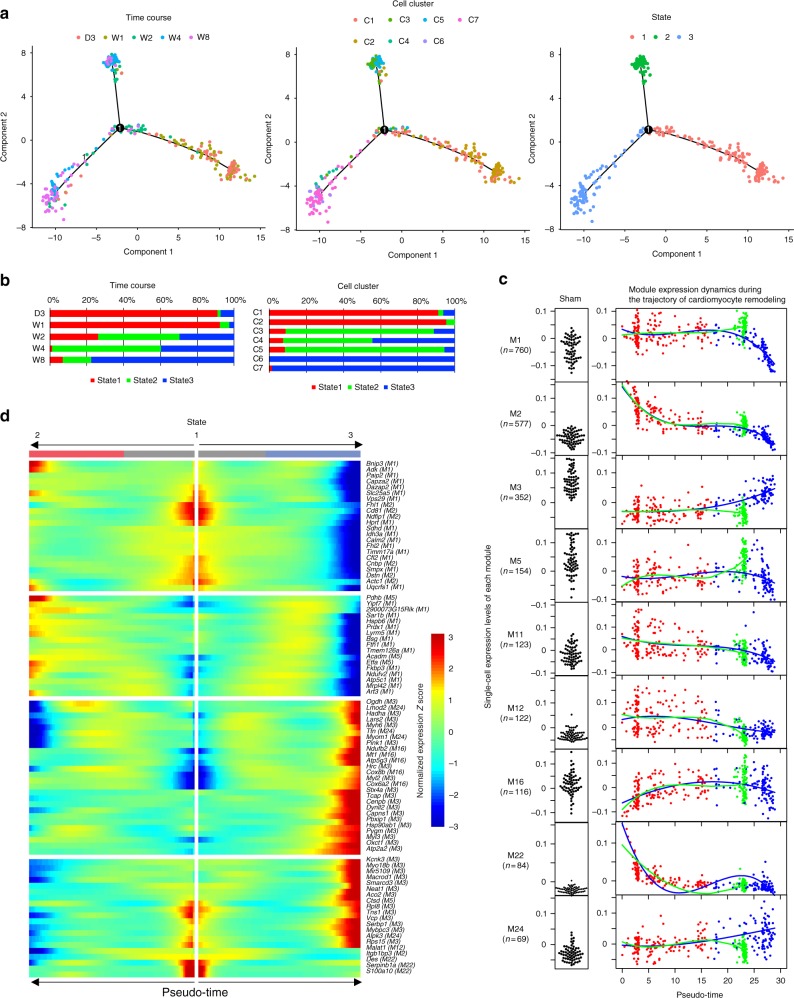
Fig. 2.
Single-cardiomyocyte trajectory analysis. a Single-cardiomyocyte trajectory after TAC operation reconstructed by Monocle. Cells are colored by the time when cardiomyocytes were extracted (left), according to the cell clusters (middle), and by the cell states annotated by Monocle (right). b Bar plot showing the distribution of the cell states (State 1, State 2, and State 3) at each time point (left) and in each cell cluster (right). c Module expression dynamics along the pseudo-time reconstructed by Monocle. Dot colors indicate state colors, matching the colors in b. Single-cell expression levels of each module in sham cardiomyocytes are represented as black dots (left). The fitted curves for the trajectory into State 2 (green) and State 3 (blue), and the number of genes assigned to the corresponding modules are also shown. d Heatmap showing the expression levels of differentially expressed genes during the trajectory. Corresponding modules are also denoted in parentheses

