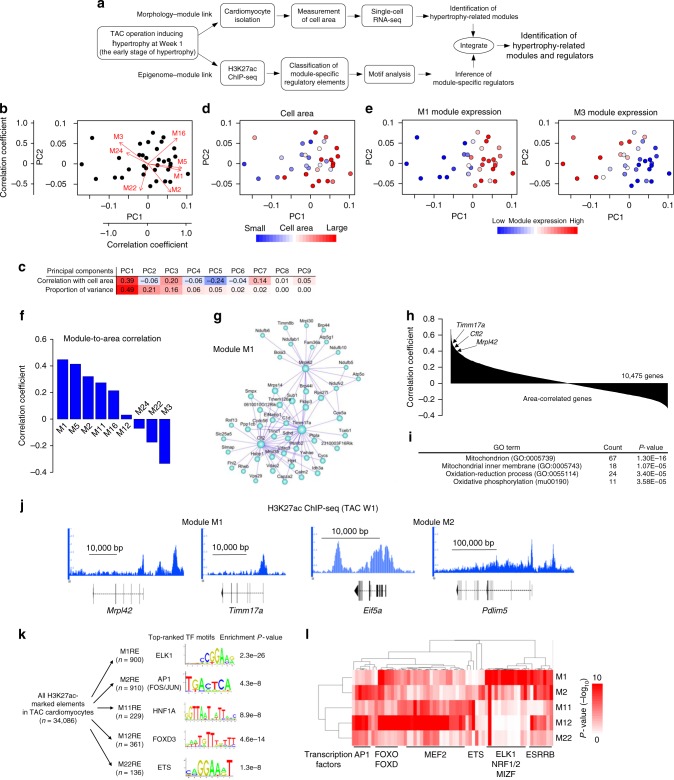
Fig. 3.
Hypertrophy-related modules and regulatory factors. a Experimental scheme to identify hypertrophy-related modules and regulators. b Principal component analysis (PCA) plot of cardiomyocytes from mice at 1 week after TAC in a. Arrows denote the correlation coefficients of the respective module with each principal component. c Correlation coefficient with cell area and proportion of variance for each principal component. d, e PCA plots colored by the cell area (d) and by the expression of each module (e). f Bar plot showing the correlation coefficient between cell area and module expression. Modules are ordered by the correlation levels. g Hub gene network of M1. The size of the dots represents node centrality. h Bar plot showing the correlation coefficient between cell area and gene expression. Genes whose expression was detected in at least one of the samples are ordered by correlation levels. i List of the most enriched GO terms in the top 300 correlated genes with cell area. j Representative genome browser views of H3K27ac ChIP-seq of cardiomyocytes from mice at 1 week after TAC. The Y-axis indicates reads per million (range, 0–3). k Transcription factor recognition motifs most significantly enriched in the regulatory elements (REs) for each module. l Hierarchical clustering of transcription factor recognition motifs. The top 10 significantly enriched motifs for each module are selected. Transcription factors strongly expressed in cardiomyocytes are shown below the heatmap

