Fig. 4.
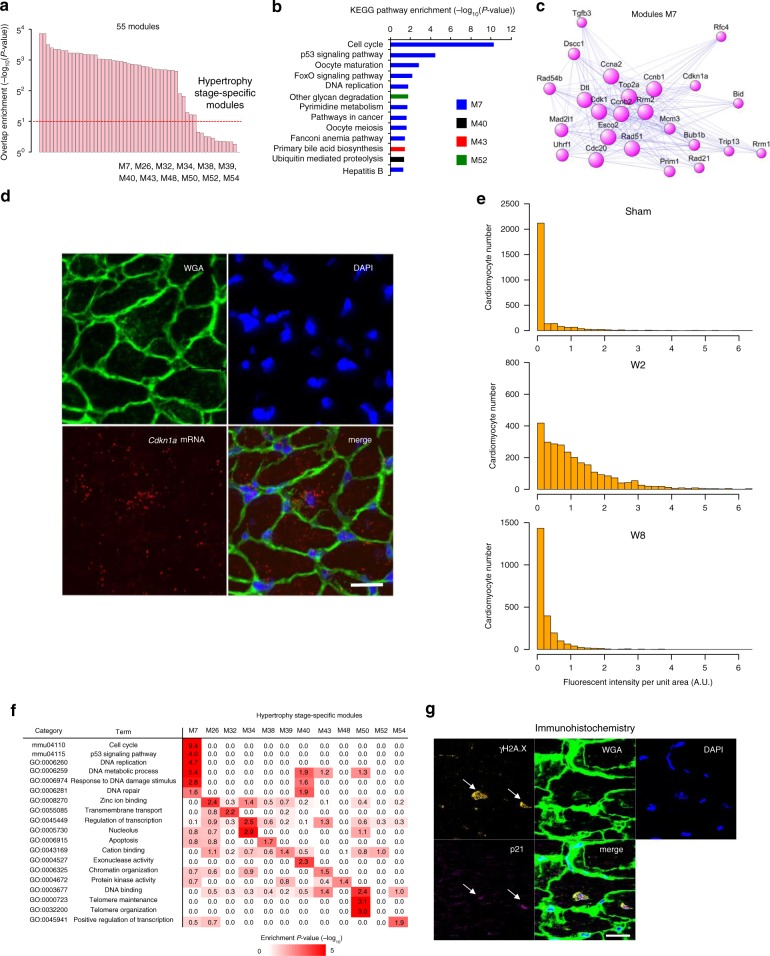
Hypertrophy-stage-specific p53 signaling activation. a Bar plot showing the statistical significance of the overlap between modules detected from co-expression analysis with or without hypertrophy-stage cardiomyocytes. The most strongly overlapping module pairs are selected from Supplementary Fig. 13a. Modules are ordered by significance level. The red line indicates the threshold for hypertrophy stage-specific modules. b KEGG pathway enrichment of 12 hypertrophy stage-specific modules identified in a and Supplementary Fig. 13a. c Co-expression network analysis of M7. d Representative images of Cdkn1a mRNA smFISH in the heart from mice at 2 weeks after pressure overload. Wheat germ agglutinin (WGA) and DAPI are used as markers of the plasma membrane and nucleus, respectively. Scale bar, 20 μm. e Bar plots showing the distribution of cells corresponding to the single-cell fluorescent intensity of Cdkn1a mRNA detected by smFISH in the heart after sham and TAC (weeks 2 and 8) operation. f Heatmap showing the enrichment of GO and KEGG pathway terms in 12 hypertrophy stage-specific modules. g Immunohistochemical staining of gH2A.X and p21 in the heart of mice at 2 weeks after pressure overload. WGA and DAPI are used as markers of the plasma membrane and nucleus, respectively. Arrows indicate the nuclei of gH2A.X and p21 double-positive cardiomyocytes. Scale bar, 20 μm

