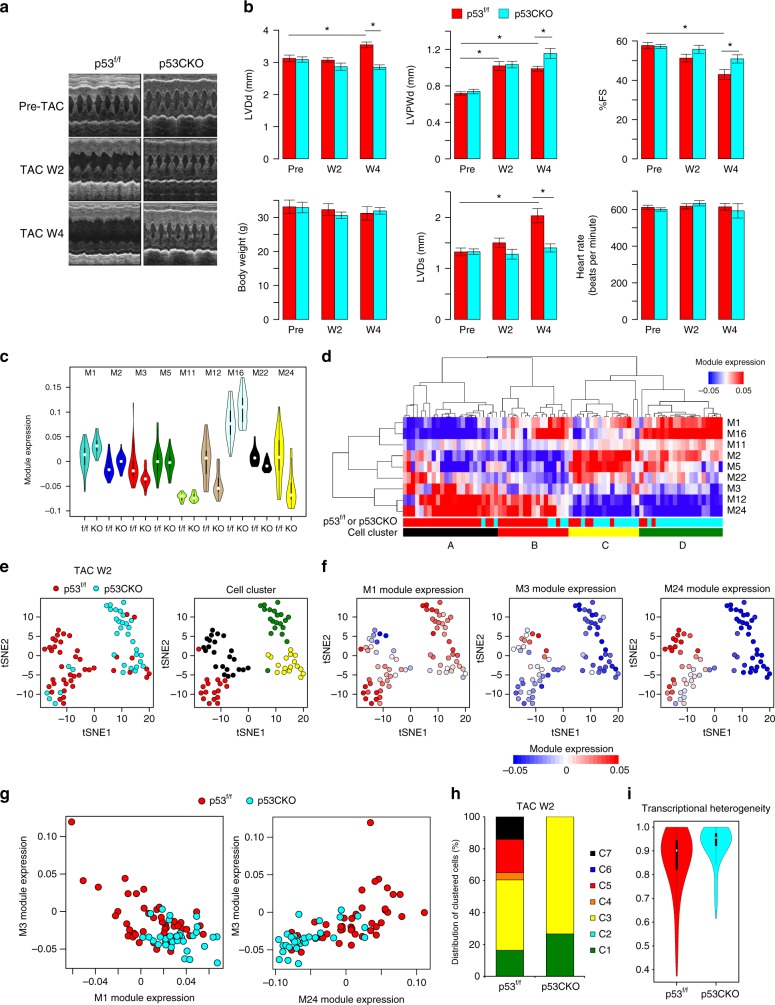
Fig. 5.
p53 is necessary for the emergence of failing cardiomyocytes and the development of heart failure. a Representative images of an echocardiographic assessment of p53flox/flox (p53f/f) and p53CKO mice before and after TAC (weeks 2 and 4). b Bar plots showing body weight, cardiac size, and cardiac function evaluated by echocardiography in p53f/f and p53CKO mice before and after pressure overload. Mean and standard error of the mean are shown (n = 12 [p53f/f] and 15 [p53CKO] for pre-TAC, 11 [p53f/f] and 10 [p53CKO] for post-TAC W2, and 7 [p53f/f] and 7 [p53CKO] for post-TAC W4). Asterisks indicate statistical significance (P < 0.05, two-tailed unpaired t-test). c Violin plot showing the distribution of the correlation coefficients of single-cell transcriptomes among cardiomyocytes from p53f/f and p53CKO mice at 2 weeks after TAC (43 p53flox/flox and 34 p53CKO cardiomyocytes). d Unsupervised hierarchical clustering classifying cardiomyocytes (p53f/f and p53CKO cardiomyocytes [TAC W2]) into four cell clusters (cell clusters A–D). Colored bars below the heatmap indicate the cell sources (p53f/f [red] or p53CKO [cyan]) and the cell clusters (A–D). e t-SNE plots of cardiomyocytes from p53f/f and p53CKO mice at 2 weeks after TAC. Cells (dots) are colored by the cell sources (left) and according to the cell clusters in d (right). f t-SNE plots colored by the expression of each module. g Scatter plots showing the expression of M1 and M3 (left) and M3 and M24 (right) in cardiomyocytes from p53f/f and p53CKO mice. h Bar plot showing the distribution of allocated cardiomyocytes from p53f/f and p53CKO mice (TAC W2). i Violin plot showing the distribution of the correlation coefficients of single-cell transcriptomes among cardiomyocytes from p53f/f and p53CKO mice (TAC W2)

