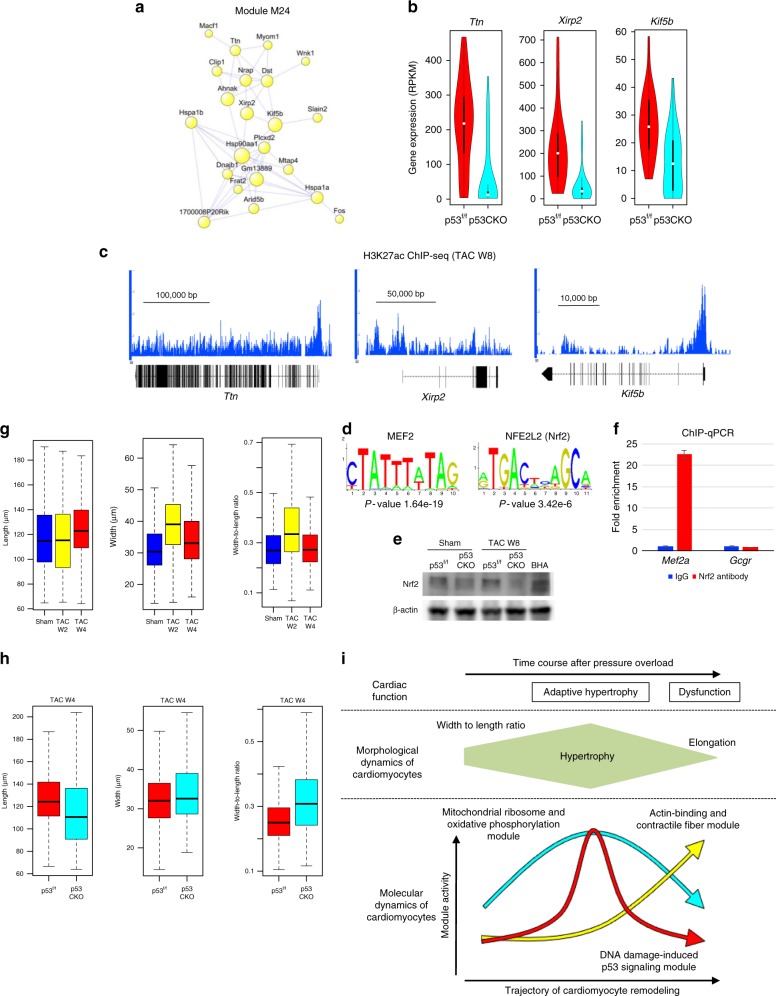
Fig. 6.
p53 induces molecular and morphological remodeling leading to heart failure. a Co-expression network analysis of M24. b Violin plots showing the expression of Ttn, Xirp2, and Kif5b in cardiomyocytes from p53f/f and p53CKO mice at 2 weeks after TAC (43 p53flox/flox and 34 p53CKO cardiomyocytes). c Representative genome browser views of H3K27ac ChIP-seq of cardiomyocytes at 8 weeks after TAC. The Y-axis indicates reads per million (range, 0–4). d The enriched transcription factor recognition motifs at the H3K27ac-positive regions (TAC W8 cardiomyocytes) around the M24 genes. e Western blot analysis of heart tissues using antibodies against Nrf2 and β-actin. Butylated hydroxyanisole (BHA), an oxidative stress inducer, was used as a positive control. Uncropped images of the blots are shown in Supplementary Fig. 14d. f ChIP-qPCR analysis of cardiomyocytes from mice at 8 weeks after TAC operation. Data are represented as mean and standard error of the mean (n = 3 each). The Gcgr locus was used as a control region. g Boxplots showing the distribution of the morphological parameters of cardiomyocytes from mice after sham and TAC operation (n = 1243 [Sham], 1366 [TAC W2], 717 [TAC W4] from three mice each). Horizontal lines indicate the medians. Boxes show the 25th–75th percentiles. Whiskers represent the minimum and maximum values. h Boxplots showing the distribution of morphological parameters of cardiomyocytes from p53f/f and p53CKO mice at 4 weeks after TAC (n = 1761 [p53f/f], 1538 [p53CKO] from three mice each). Horizontal lines indicate the medians. Boxes show the 25th–75th percentiles. Whiskers represent the minimum and maximum values. i Model for the coordinated molecular and morphological dynamics of cardiomyocytes leading to heart failure

