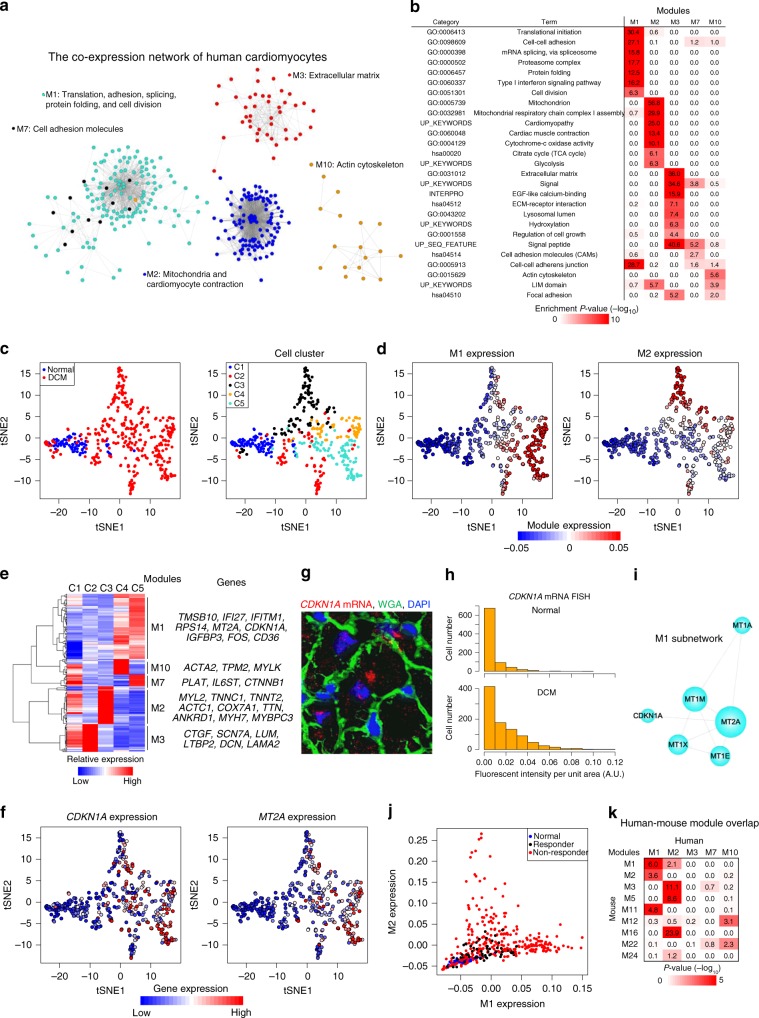
Fig. 7.
Distinct gene programs and their pathogenicity in human cardiomyocytes. a Co-expression network of human cardiomyocytes. Dot colors indicate module colors, matching the colors in b. b Heatmap showing the enrichment of GO and KEGG pathway terms in each module. c t-SNE visualization of human cardiomyocytes (71 normal and 340 dilated cardiomyopathy (DCM) cardiomyocytes). Cells (dots) are colored according to the cell clusters in Supplementary Fig. 16b. d t-SNE plots of human cardiomyocytes colored by the expression of each module. e Heatmap showing the relative average expression for characteristic genes across the five modules. Representative genes are also indicated. f t-SNE plots of human cardiomyocytes colored by the expression of each gene. g Representative images of CDKN1A mRNA smFISH of the DCM heart. WGA and DAPI are used as markers of the plasma membrane and nucleus, respectively. Scale bar, 20 μm. h Bar plots showing the distribution of cells corresponding to the single-cell fluorescent intensity of CDKN1A mRNA detected by smFISH in the normal and DCM hearts. i Subnetwork analysis of human M1. j Scatter plot showing the relationship between M1 and M2 expression. DCM cardiomyocytes are separated into two groups: responder (n = 59) and non-responder (n = 281). k Heatmap showing the significance of gene overlaps between human and mouse modules. The table is colored by −log10(P-value), obtained with Fisher’s exact test, according to the color legend below the table

