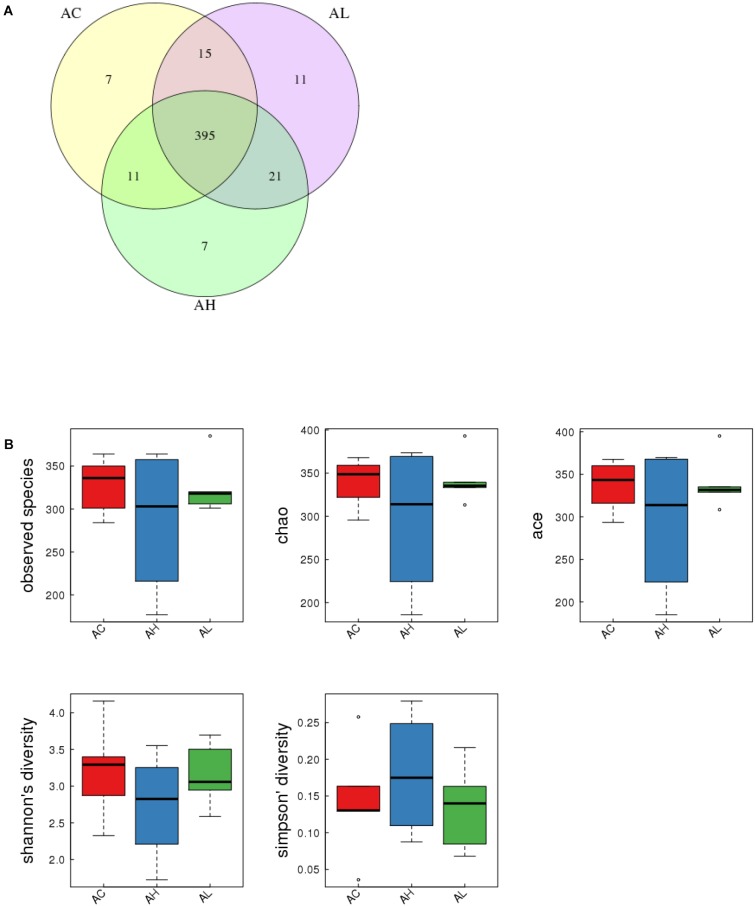
FIGURE 3.
Effect of 7-week dietary PFOS exposure on gut bacterial structure in mice. (A) Comparison of operational taxonomic units (OTUs); different colors represent distinct groups: (i) control (AC), (ii) low-dose PFOS exposure (AL), and (iii) high-dose PFOS exposure (AH). The intersection represents the set of OTUs commonly present in the counterpart groups. Venn diagram was drawn using VennDiagram software R (v3.0.3). (B) Changes in observed species number, Chao1 index, Ace index, Shannon’s diversity, and Simpson’s diversity; the results suggest that dietary PFOS intake exerted no effect on the species diversity of the gut bacterial community.

