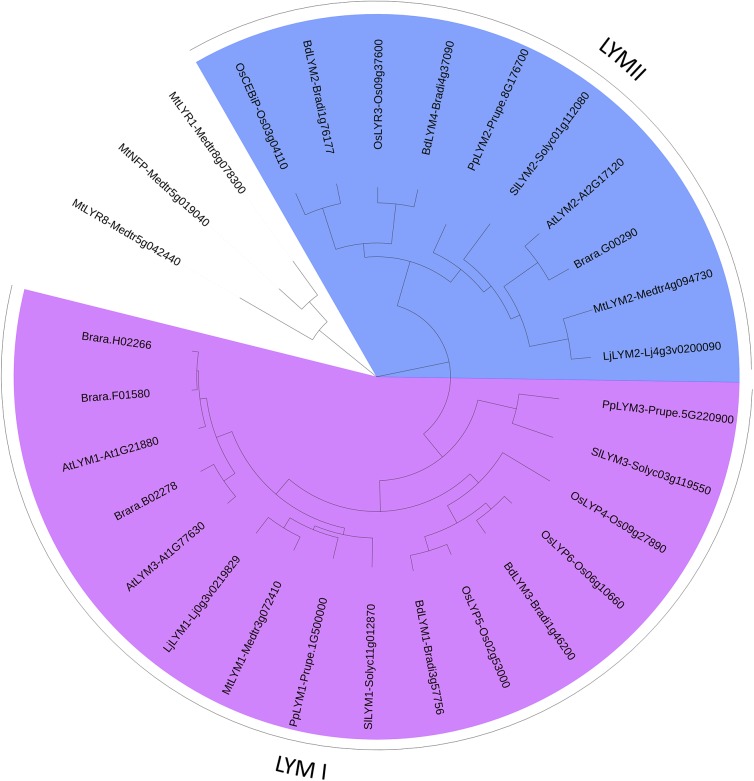
FIGURE 3.
PhyML phylogenetic tree of the LYMs. Different phylogenetic groups are shown in different colors. ECRs of 3 LYR proteins were used as outgroup sequences. The sequences corresponding to the LYM proteins were aligned with Mafft (v7.271; Katoh et al., 2002) with the following parameters: maxiterate = 1000, retree = 1, genafpair = true. The best evolutionary model fitting the alignment was identified using ProtTest (v2.4). This best model was: WAG + I + G, alpha = 2.69, p-inv = 0.05. The phylogenetic tree was computed using a maximum-likelihood method with phyml (v20130805; Guindon et al., 2010). The branch confidence was evaluated using the Approximate Likelihood-Ratio Test (Anisimova and Gascuel, 2006). Finally, the tree was drawn with Itol v3 (Letunic and Bork, 2016).

