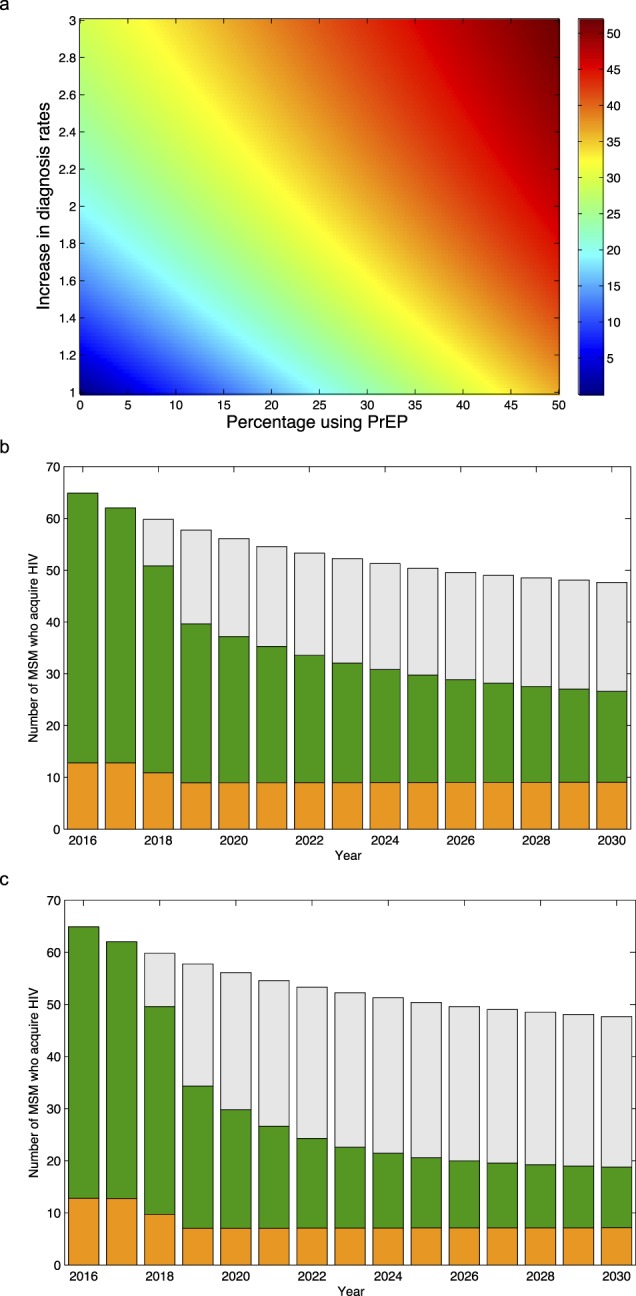
Figure 3.

Predictions showing the impact of introducing PrEP with, and without, an increase in diagnosis rates. (a) Heat map showing results from the sensitivity analysis: predictions for the effectiveness of PrEP with, and without, an increase in diagnosis (and hence treatment) rates. The magnitude of the increase in the diagnosis rate in each CD4 stage is relative to the current diagnosis rate. The color scale shows effectiveness as a percentage reduction in the cumulative number of infections between 2018 and 2030. (b) Predictions for the number of MSM who acquire HIV each year under the assumption that PrEP coverage reaches 50%, but diagnosis rates remain at their current levels. Infections shown in green occur in Denmark. Infections shown in orange occur abroad. Grey bars show predicted values without PrEP. (c) Predictions for the number of MSM who acquire HIV each year under the assumption that the introduction of PrEP will be accompanied by a doubling of diagnosis rates, PrEP coverage in Denmark reaches 50%, and 80% of Danish MSM use PrEP when they travel abroad. Infections shown in green occur in Denmark. Infections shown in orange occur abroad. Grey bars show predicted values without PrEP or an increase in diagnosis rates.
