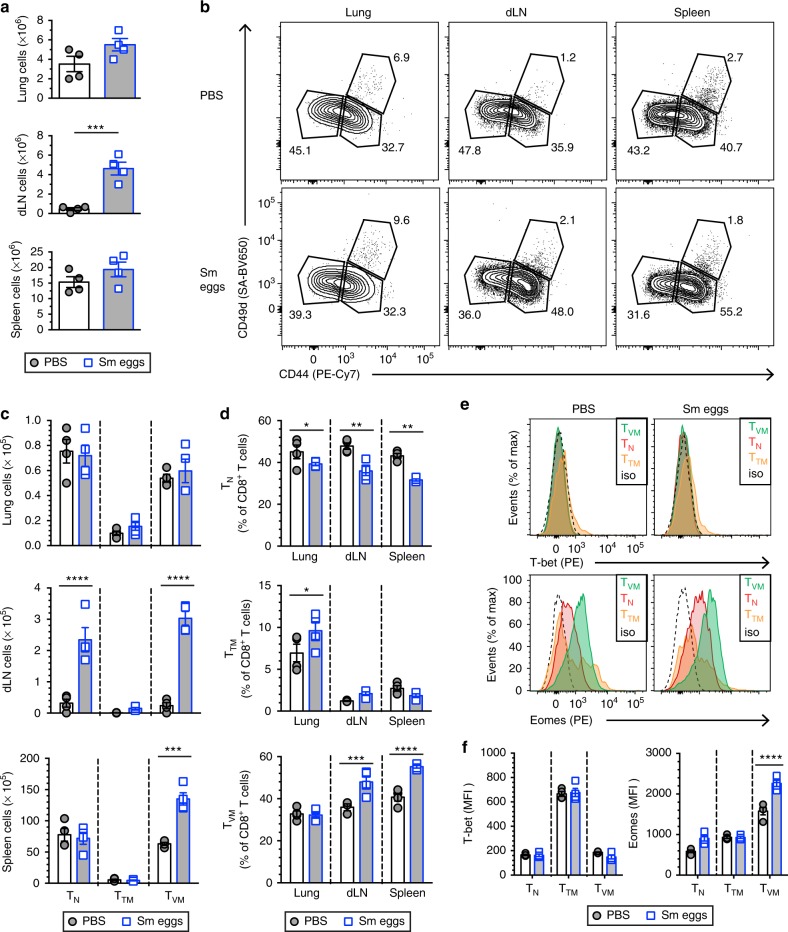
Fig. 1.
S. mansoni eggs induce CD44hiCD49dlo CD8+ T cell expansion in the draining LN and spleen. BALB/c mice were injected with S. mansoni (Sm) eggs i.p. and challenged i.v. (5000 per injection) at d14 before analysis at d22. a Absolute cell number at d22 in the indicated tissue. b Representative flow contour plots of gated CD8+ T cells of the indicated tissue at d22. Numbers indicate percent of events in each gate. c Cell number of CD44lo (naive T cells, TN), CD44hiCD49dhi (true memory T cells, TTM) and CD44hiCD49dlo (virtual memory, TVM) CD8+ T cells as determined by flow cytometric analysis. d Percentage of CD44lo TN, CD44hiCD49dhi TTM and CD44hiCD49dlo TVM cells in CD8+ T cells as determined by flow cytometric analysis. e Representative histograms of PBS- or Sm egg-treated spleen CD8+ T cells. Gates were placed on CD44lo TN, CD44hiCD49dhi TTM and CD44hiCD49dlo TVM cells. Flow histograms show respective expression of Eomes and T-bet. f Median fluorescence intensities (MFI) of T-bet and Eomes at day 22 from the indicated populations after Sm egg injection. Statistical significance calculated using two-way analysis of variance (ANOVA) and Dunnett’s (PBS as reference mean) or Sidak’s multiple-comparison test (**P < 0.01, ***P < 0.001, ****P < 0.0001). Data are representative of three independent experiments with 4 mice per group (mean ± s.e.m. in a, c, d, f)

