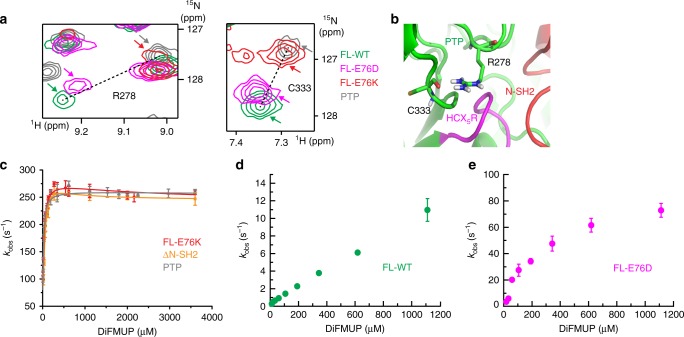
Fig. 3.
Open/closed equilibrium of WT and SHP2 mutants correlates with enzymatic activity. a Selected region of the [1H-15N]-TROSY-HSQC spectra (residues R278 and C333 in the PTP domain) shows linear shifting of cross peaks from PTP via FL-E76K and FL-E76D to FL-WT. b R278 and C333 are shown in stick representation, showing their spatial proximity to the active site of the catalytic domain (the HCX5R motif) and the N-SH2 domain. c–e Phosphatase activity as a function of substrate (DiFMUP) concentration measured at 35 °C. c The profiles for PTP, ΔN-SH2, and FL-E76K are within experimental error and were fit to the Michaelis–Menten model with partial substrate inhibition (Eq. 1, fit parameters in Supplementary Fig. 7b). d, e FL-WT and FL-E76D show much less activity combined with a weaker apparent KM. Uncertainties represent the standard deviation of the sample (n = 3)

