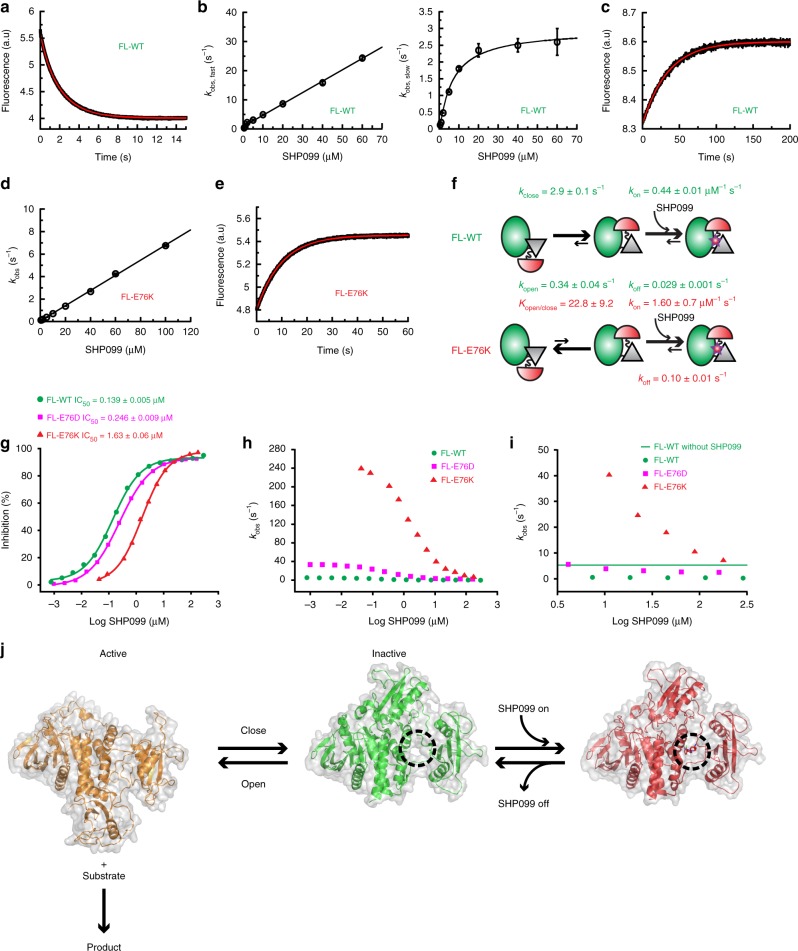
Fig. 6.
Binding kinetics of SHP099 explains its reduced potency for FL-E76K. a Representative stopped-flow fluorescence trace shows a double-exponential decay after mixing 0.5 μM FL-WT and 2.0 μM SHP099. b The extracted rates for the double-exponential decays are plotted against the SHP099 concentration. The rates for the faster phase are linearly dependent on the SHP099 concentration and represent the binding step (left), whereas those for the slower phase plateau and reflect the conformational selection step (right). c Dissociation kinetics measured after an 11-fold dilution of the FL-WT/SHP099 complex. d Binding kinetics of FL-E76K appears single exponential with a decrease of about sevenfold in the observed rate constants compared with FL-WT in b. e Dissociation kinetics of the FL-E76K/SHP099 complex measured as described in c. f The measured and calculated rates are shown in the proposed binding scheme. The kopen is calculated from the experimentally measured kclose and the NMR-derived equilibrium constant. g Inhibition constants (IC50) and h, i plot of observed activity as function of SHP099. i Is a zoom-in of h and the green line indicates basal wild-type activity without drug. Uncertainties in g were obtained from the fit to the data. j Scheme of conformational sampling and its role in catalysis and drug binding. Surface representation of ΔN-SHP2 (gold, PDB 6cmq) as the open/active conformation, ligand-free FL-WT (PDB 4dgp15) showing a cavity formed between the two interdomain linkers and the PTP domain where SHP099 binds (black dotted circle) and FL-E76K bound to SHP099 (red, PDB 6cms). The experiments in a, c, and e were repeated five times. Data points and error bars in b and d are the average and standard deviations of the analysis of replicate experiments (n = 5). In f, the values and standard deviations were obtained from the fitting

