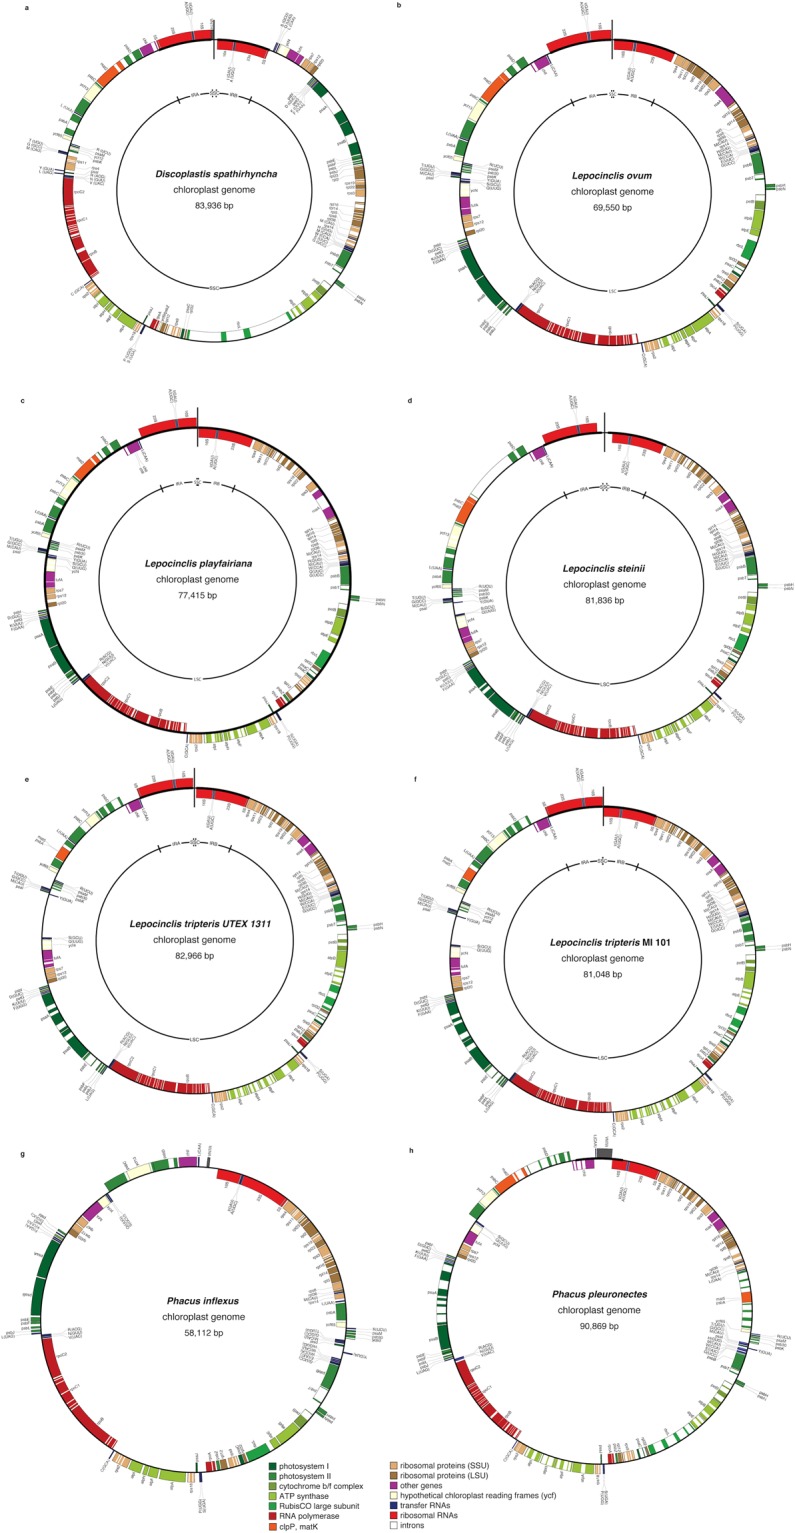
Figure 1.

Gene maps of plastid genomes. Boxes of different colors represent genes of similar functional groups. Genes on the outside of the circle are considered on the positive strand, genes inside the circle on the negative strand. (a) Plastid genome map of D. spathirhyncha, (b) L. ovum, (c) L. playfairiana, (d) L. steinii, (e) L. tripteris MI 101, (f) L. tripteris UTEX 1311, (g) P. inflexus, (h) P. pleuronectes. The vertical line at the top of the circle indicates that there is a gap and the genomes are not circularized.
