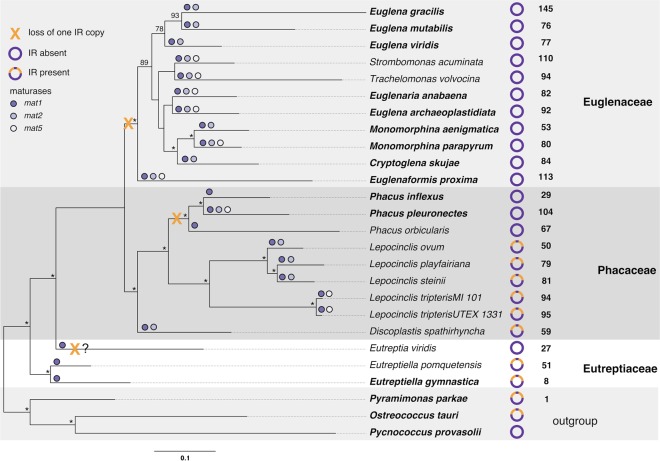
Figure 2.
Phylogenetic relationship among the Euglenophyta, with number of introns, presence of maturases and inverted repeat (IR) losses, indicated. The best-scoring maximum likelihood (ML) tree inferred from 57 cpDNA-encoded proteins and two rRNA genes is presented. The numbers on the nodes indicate the ML bootstrap support (bs). An asterisks (*) indicates that the corresponding branch received a BS value of >95%; values below <70% are not presented. The scale bar denotes the estimated number of amino acid substitutions per site. The plastid structure and number of introns are depicted next to the name of the taxa. Number and type (mat1, mat2, mat5) of maturases are denoted on the branches by dots. Species names in bold indicate that their plastid genome sequence is complete.

