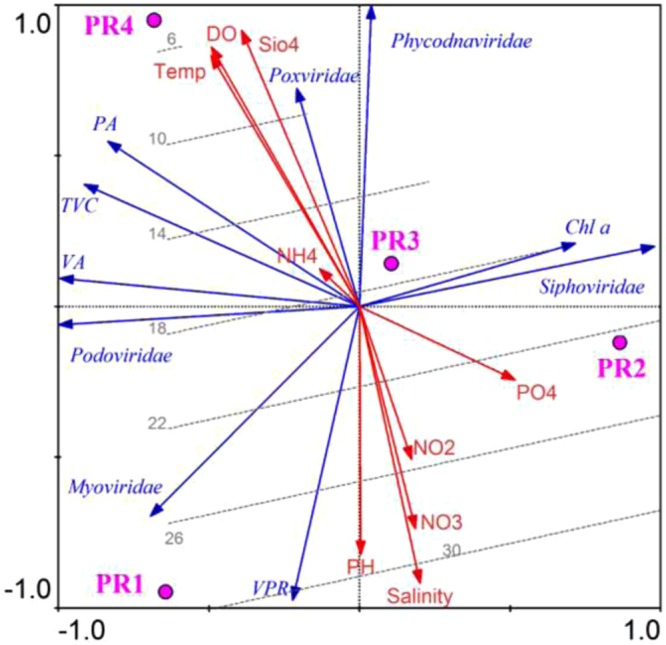
Figure 3.

RDA triplot representing the distribution of viral families (Myoviridae, Siphoviridae, Podoviridae, Poxviridae, Phycodnaviridae) along with physicochemical (red lines) and biological parameters (blue lines) in the Cochin estuary (CE). Salinity contours (dotted lines) are overlaid on the triplot to show the interrelationships between physicochemical and biological parameters on distribution of viral families in the CE. The stations PR1, PR2, PR3 and PR4 are represented as pink filled dots.
