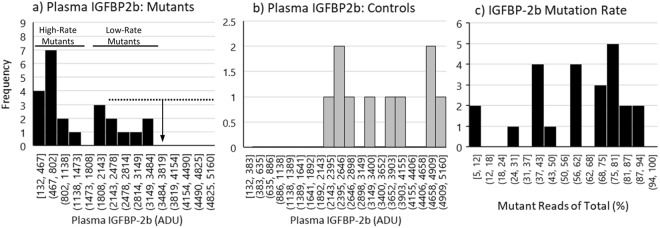
Figure 7.
Histograms indicating the frequency distribution of the IGFBP-2b phenotype (panel a: mutants, panel b: controls) and mutant genotype (mutants: panel c). The solid horizontal lines represent the separation of the mutants into high-rate (<50% IGFBP-2b) and low-rate (>50% IGFBP-2b) mutant groups. The dashed horizontal line in panel a represents the range of IGFBP-2b values in control fish while the vertical arrow represents the control mean. The values on the x-axis represent the lower and upper boundary for each bin. ADU: arbitrary density units.

