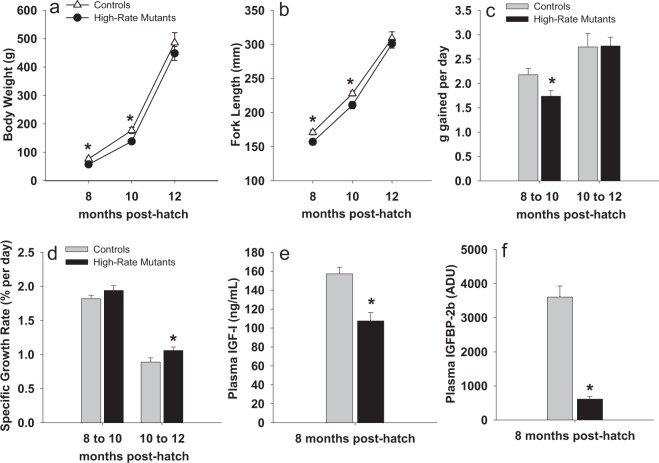
Figure 8.
Growth-related performance and plasma IGF-I and IGFBP-2b abundance in controls (n = 10) and high-rate mutants (<50% IGFBP-2b, n = 14). In panels a and b, data for high-rate mutants are presented as closed circles while control fish are presented as open triangles. In panels (c–f), gray bars represent the control group while dark bars represent the high-rate mutant group. Bars indicate means ± SEM. Asterisks indicate a significant difference between groups, P < 0.05. ADU: arbitrary density units.

