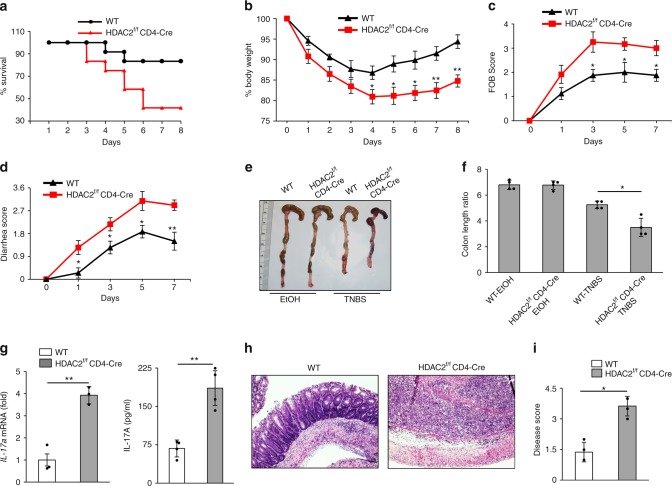
Fig. 6.
HDAC2f/f CD4-Cre mice show enhanced colitis. Data shows a survival curve (%) (n = 12 per group), b percentage change in body weight, c FOB score, d diarrhea score, and e, f colon length of WT mice and HDAC2f/f CD4-Cre mice (n = 6 per group) after intrarectal administration of 2.5% TNBS. g Real-time PCR and ELISA were used to analyze IL-17A expression in WT mice and HDAC2f/f CD4-Cre mice given TNBS. h H&E-stained colonic sections and i disease scores of those sections are shown from WT mice and HDAC2f/f CD4-Cre mice as in a–d (n = 4). Data are from one experiment representative of three independent experiments with similar results. *p < 0.05 and **p < 0.01 (two-tail t test) error bars are S.D.

