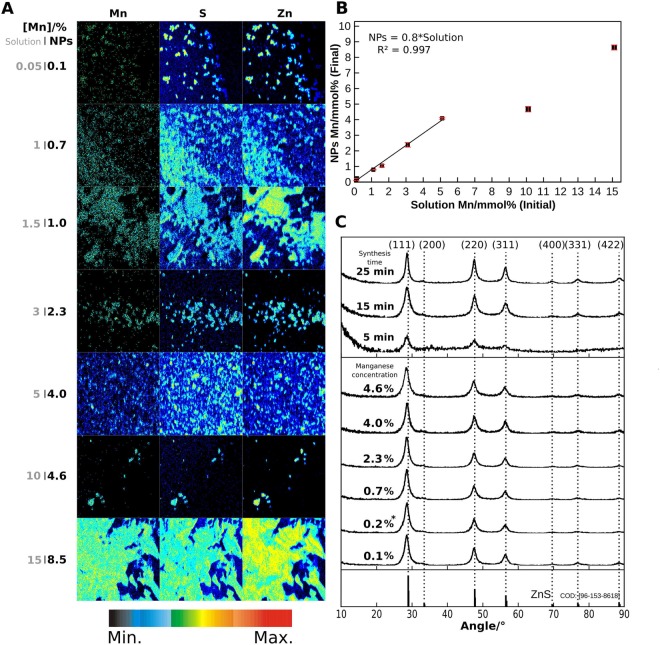
Figure 2.
(A) Images of powder samples PIXE relative intensity, in a 1320 × 1320 µm2 area, of manganese, sulfur and zinc. The initial (gray) and final (black) manganese percentages are shown beside each sample. The bottom color bar represents the relative PIXE intensity. (B) Plot of the previous percentages, including estimated error bars, and linear correlation from 0.05% to 5% initial concentration. (C) X-ray diffraction patterns of undoped and doped zinc sulfide nanoparticles synthesized for 5 min, 15 min and 25 min at 300 °C and different concentrations of manganese, for 25 min at 300 °C. The vertical dashed lines denote the corresponding crystal planes and the reference pattern of ZnS sphalerite is included in the bottom. The asterisk denotes an extrapolated concentration value from PIXE results, corresponding to 0.2% initial manganese concentration.

