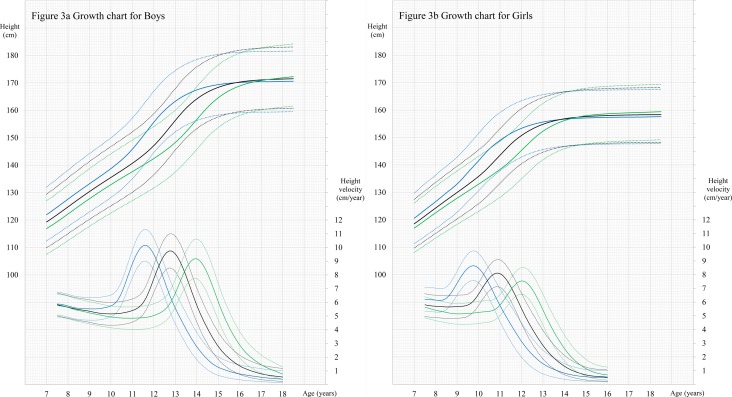
Fig. 3.
a: Longitudinal growth charts for boys. The smoothing curves for groups 1, 2, and 3 are represented by blue, black and green lines, respectively. The solid lines represent a 0 z-score and the dotted lines represent a ± 2 z-score for height and ± 1 z-score for height velocity. b: Longitudinal growth charts for girls. The smoothing curves for groups 1, 2, and 3 are represented by blue, black and green lines, respectively. The solid lines represent a 0 z-score and the dotted lines represent a ± 2 z-score for height and ± 1 z-score for height velocity.

