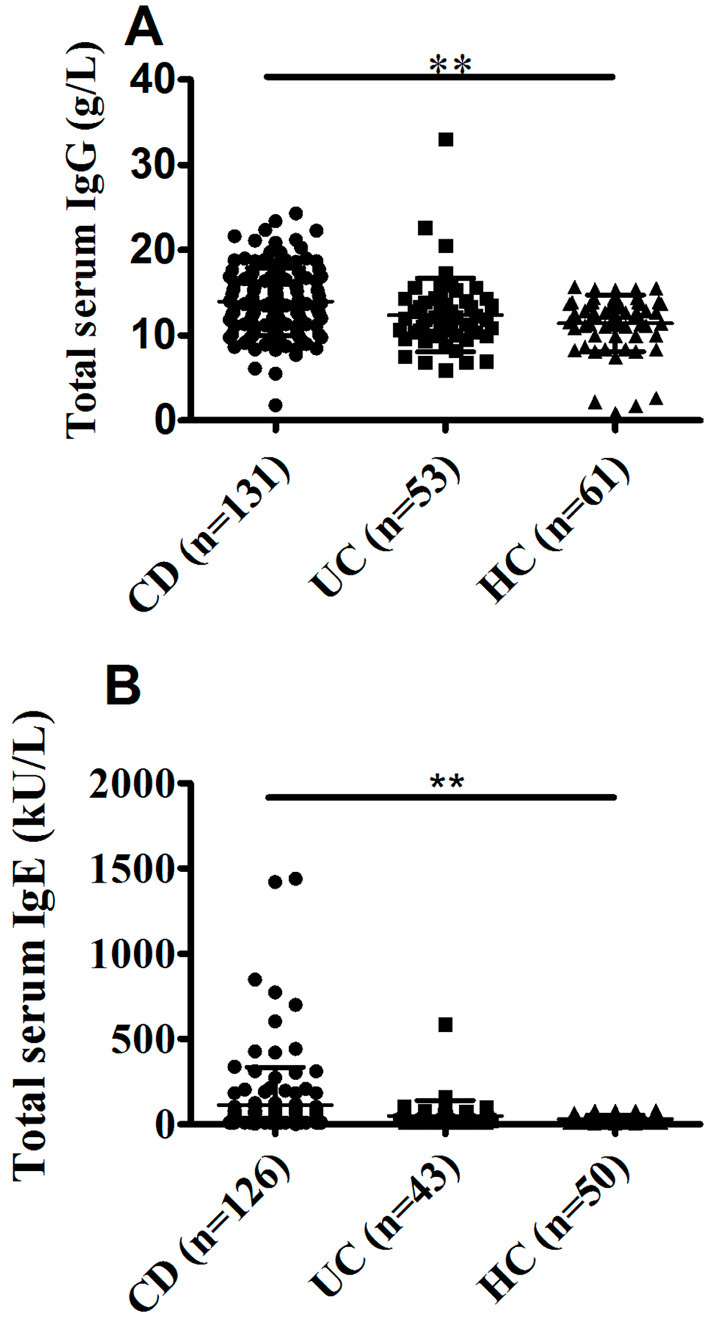
Figure 4.

A comparison of the total serum IgG and IgE levels between CD patients, UC patients, and HCs. The levels of serum IgG and IgE were determined using the method indicated. A: Total serum IgG levels in CD patients (n=131), UC patients (n=53), and HCs (n=61). B: Total serum IgE levels in CD patients (n=126), UC patients (n=43), and HCs (n=50). **p<0.01 CD.
