
Figure 4.
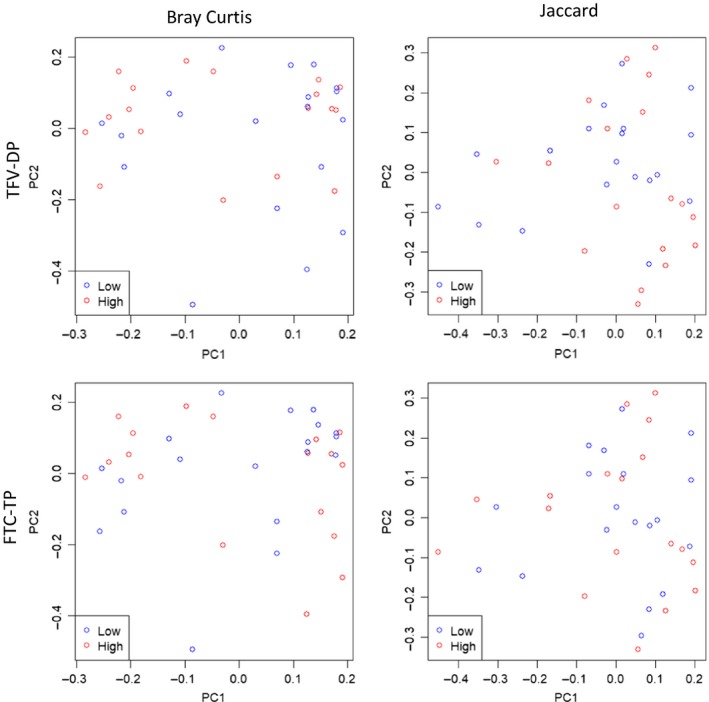
Microbiota composition are not associated with changes in PrEP drug concentrations.
Representative data for TFV‐DP and FTC‐TP drug concentrations in rectal tissues following seven days of oral TDF/FTC dosing were stratified at the median into low (blue circles) and high (red circles) drug level groups. Bray–Curtis and Jaccard distance‐based principal coordinates analysis (PCoA) plots are shown for rectal tissues demonstrating no separation between specimens with low and high drug levels. Similar results were seen for PBMC and rectal secretions specimens. FTC, emtricitabine; PBMC, peripheral blood mononuclear cell; PrEP, pre‐exposure prophylaxis; TDF, tenofovir disoproxil fumarate; TFV, tenofovir; TFV‐DP, tenofovir‐diphosphate.