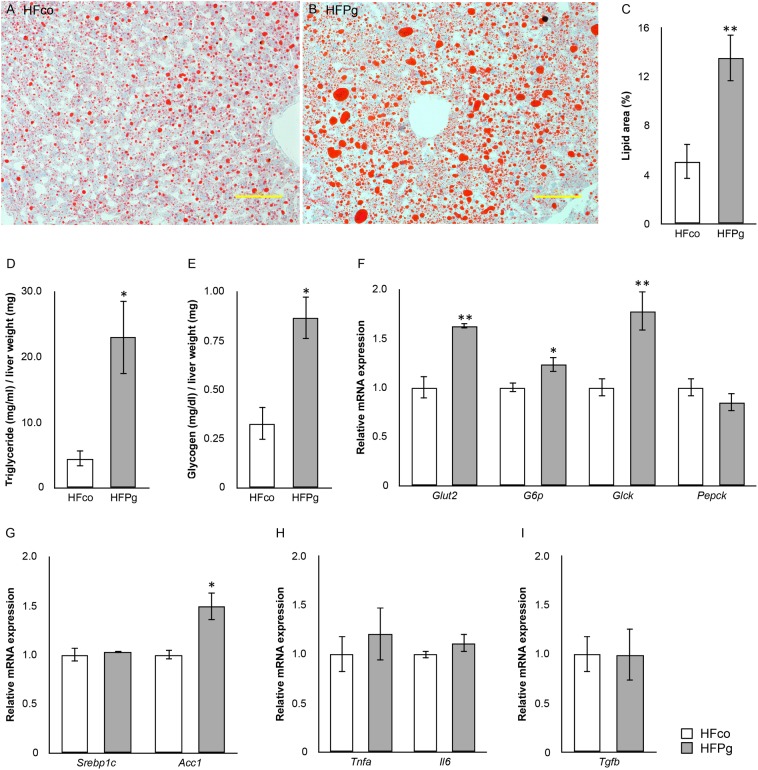
FIGURE 3.
evaluation of liver steatosis. Oil red o staining of liver tissue from (A) HFco, (B) HFg mice (row magnification × 200, yellow bar = 100 μm), and (C) lipid area (%). (D) Triglyceride and (E) glycogen in the liver of HFco and HFPg mice at 12 weeks (n = 5). (F) Glut2, G6p, Glck, and Pepck; (G) Srebp1c and Acc1; (H) Tnfa and Ilb; (I) Tgfb expressions in HFco and HFPg mice at 12 weeks (n = 5).∗P < 0.05, ∗∗P < 0.01 (unpaired t-test).

