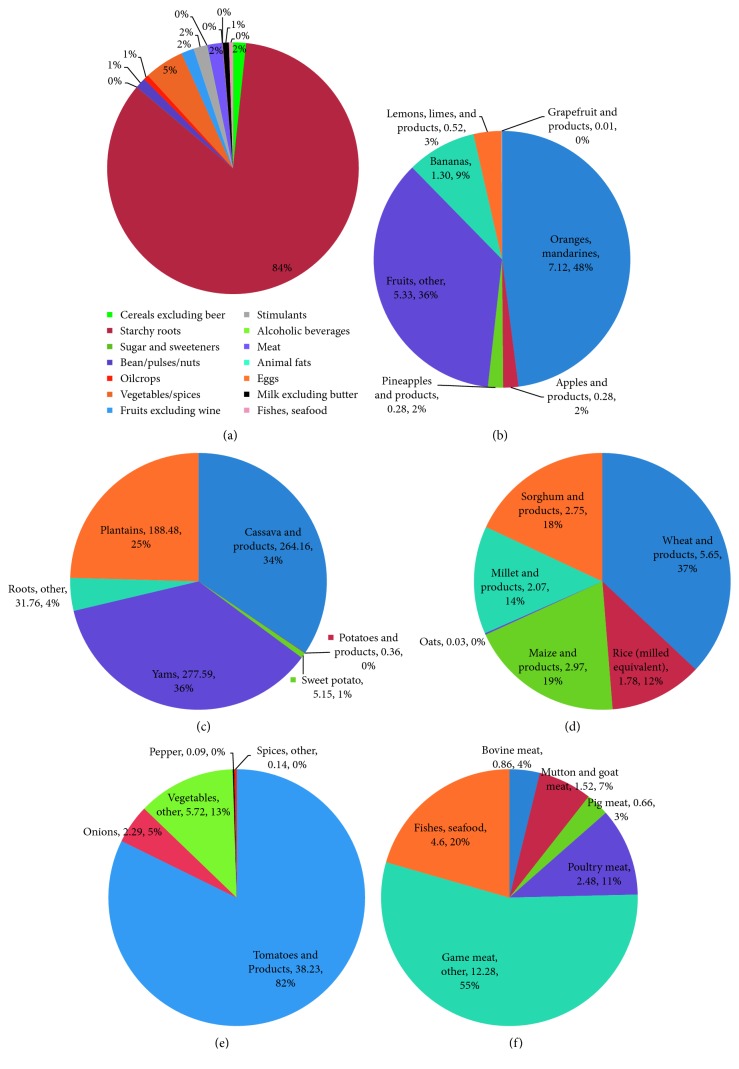
Figure 1.
Percentage contribution of main food items to total K supply for Ghana based on 2010-2011 average food supply data: (a) main food items; (b) subcomponents of the food item “fruits”; (c) subcomponents of the food item “starchy roots”; (d) subcomponents of the food item “cereals”; (e) subcomponents of the food item “vegetables”; (f) subcomponents of the food item “meat, fishes, and seafood.” All absolute values of daily per capita K shown are in ×10 mg.

