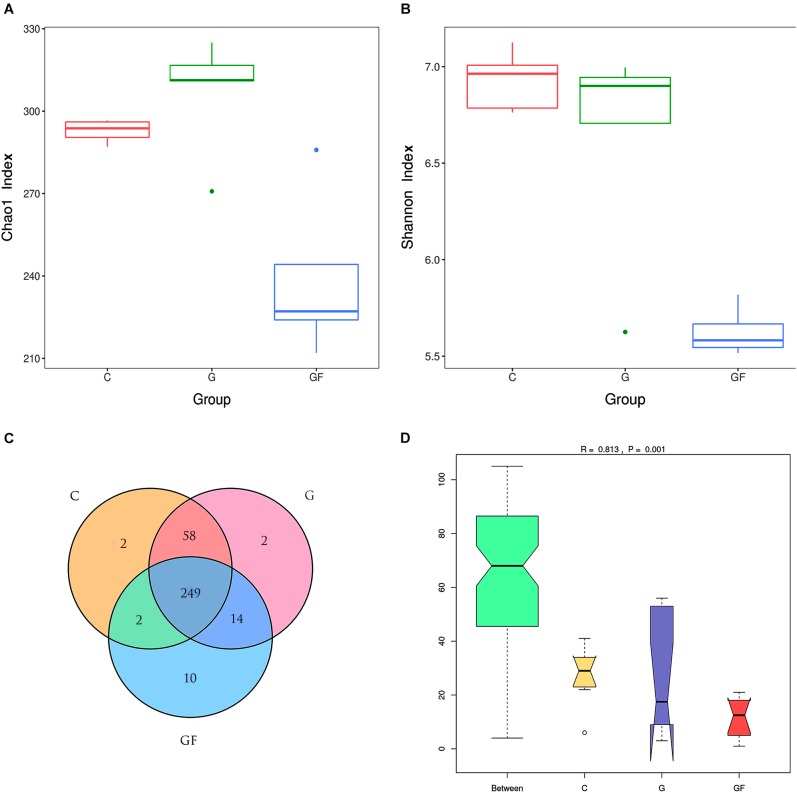
FIGURE 1.
DNA sequence data and microbial diversity index analysis. (A) Chao1 index. (B) Shannon index. (C) Venn diagram. The numbers in the figure represent the unique or common OTUs of each group. (D) ANOSIM analysis. “Between” represents the difference between the three groups, the closer the R-value is to 1, the greater the difference between the groups. “C,” “G,” and “GF” represent the different three groups.

