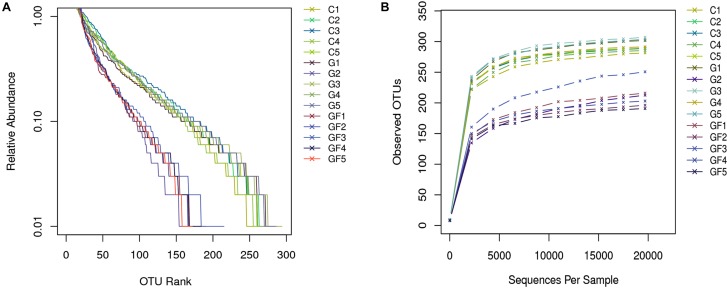
FIGURE 2.
Sample feasibility analysis. Each curve represents a sample. (A) Rank-Abundance curve. The abscissa indicates the OTU (species) abundance order, and the ordinate corresponds to the relative abundance ratio of OTU (species). (B) Rarefaction curves depicting the effect of sequences on the number of OTUs identified.

