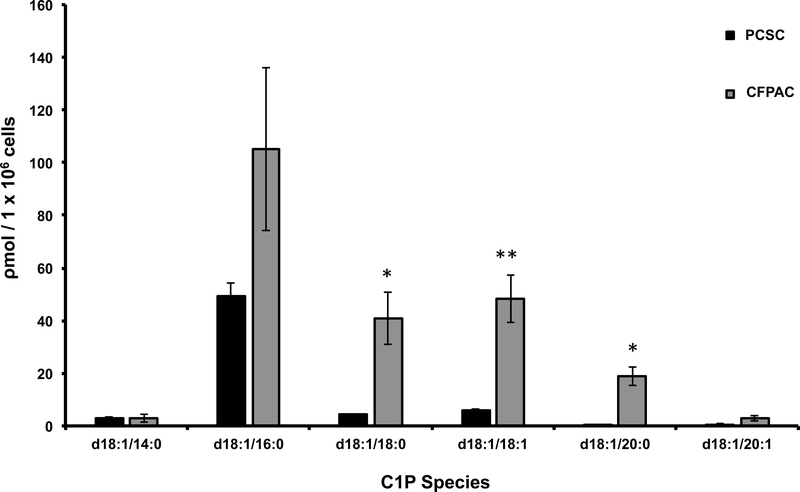
Figure 1: CFPAC cells are C1P rich.
Subconfluent CFPAC and PCSC cells were sent for analysis of C1P. Lipidomic analysis of C1P normalized to the specific isoforms standard curve, determined that C1P species d18:1/18:0-C1P (CFPAC: 41ρm ± 10SEM; PCSC:4.3ρm ± 0.2SEM, * p<0.007), d18:1/18:1-C1P (CFPAC: 48.3ρm ± 9SEM; PCSC:5.8ρm ± 0.7SEM, ** p=0.002), and d18:1/20:0-C1P (CFPAC: 18.8ρm ± 3.6SEM; PCSC:0.5ρm ± 0.1SEM, * p<0.007) were significantly increased in CFPAC versus PCSC (unpaired Student’s t-test, n= 3/experiments performed on different cell passages harvested at different times and normalized to total cell number) (nomenclature: Sphingosine backbone of C1P is - 18:1).

