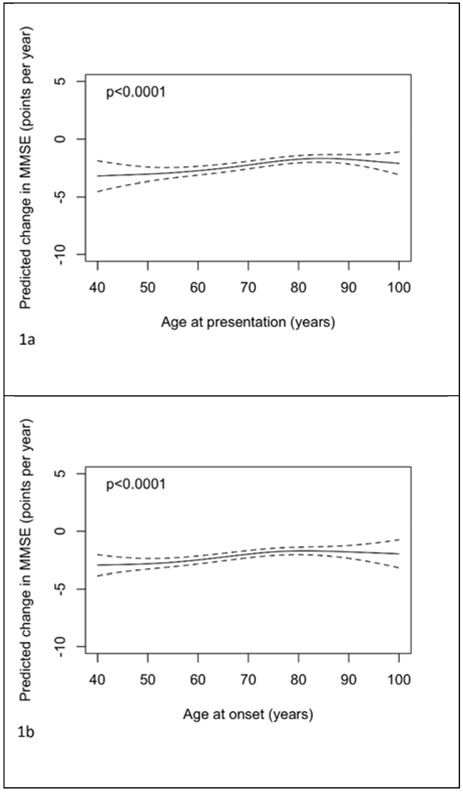
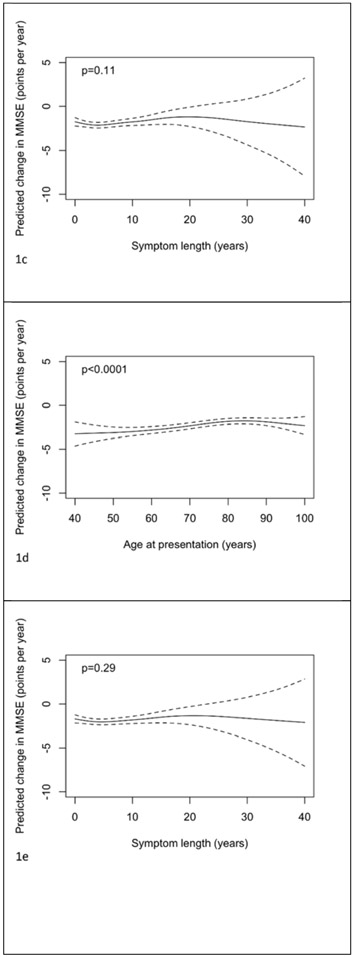
Figure 1.


Plots of predicted change in MMSE (points per year) with 95% pointwise confidence intervals with predictors being: a) age of presentation, b) age of onset, c) symptom length, d) age of presentation adjusted for symptom length and e) symptom length adjusted for age of presentation. Predictions are for a female subject, with 14 years of education, and a MMSE at presentation of 20. In plot d) the prediction is for a patient with symptom length 5 years. In plot e) the prediction is for a patient with age of presentation 75 years.
