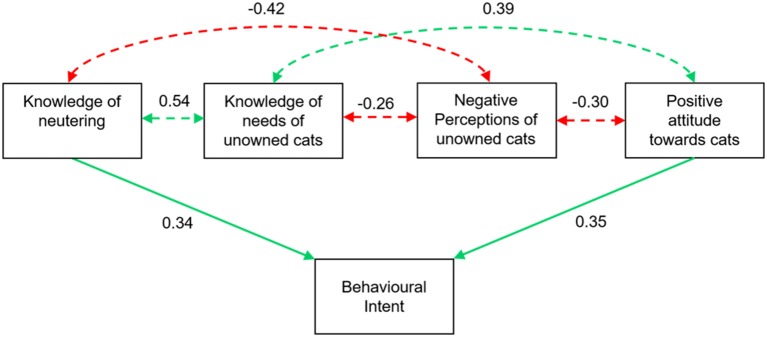
Figure 3.
Path diagram used in final structural equation model. See Table 3 for definition of variables. Solid lines indicate significant direct effects and dashed lines indicate significant correlative effects. Green show positive effects and red negative effects.

