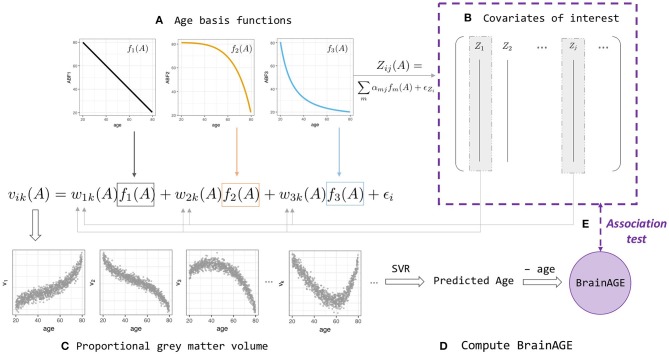
Figure 1.
BrainAGE simulation and analysis framework (Equations 2–4). (A) Linear and non-linear age basis functions (ABFs) fi (orange, black, and blue lines). For a particular individual i, the ABFs are combined to create volume k's gray matter proportion vik (orange, black, and blue arrows) and age-dependent covariates of interest, Zij(A) with a different set of coefficients αj. (B) Some of the Zij are then fed back into the wik when generating volume vik, which leads to two levels of age association between covariate and BrainAGE. (C) Proportional gray matter volume (volumetric data) generated from non-linear combinations of ABFs. (D) Predicted-age and BrainAGE computed from simulated volumetric data and simulated chronological age with Support Vector-based regression; (E) Test for association between BrainAGE and covariates of interest.

