Fig. 1.

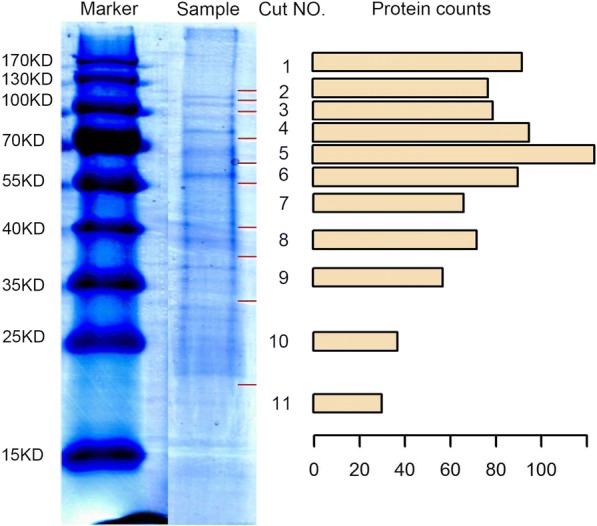
SDS-PAGE of the anal droplets. The gel was cut into 11 segments at the red line for Q-TOF. The counts of identified protein from each segment are shown in a barplot

SDS-PAGE of the anal droplets. The gel was cut into 11 segments at the red line for Q-TOF. The counts of identified protein from each segment are shown in a barplot