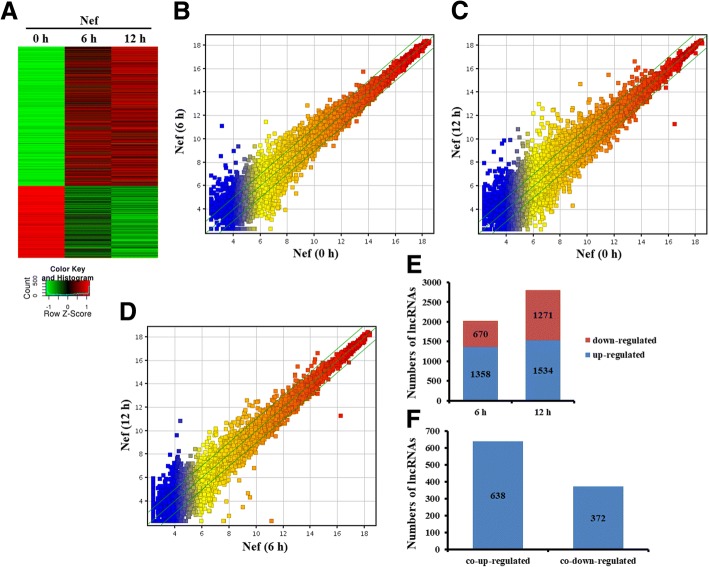
Fig. 4.
Analysis of differentially expressed lncRNAs in primary mouse astrocytes treated with Nef protein. a Heatmap of lincRNAs significantly changed upon Nef (50 ng/ml) stimulation of astrocytes. b, c, d Scatter plot compared global lncRNA expression profiles in Nef-treated astrocytes. The values of X-axis and Y-axis in the scatter plot were the normalized signal values of each sample (log2 scaled). The green lines are fold change (the default fold change value given is 2.0). The mRNAs above the top green line and below the bottom green line indicate more than 2.0-fold change, compared to the control. e Analysis of numbers of significantly expressed lncRNAs. f Overlapped and differentially expressed lncRNAs

