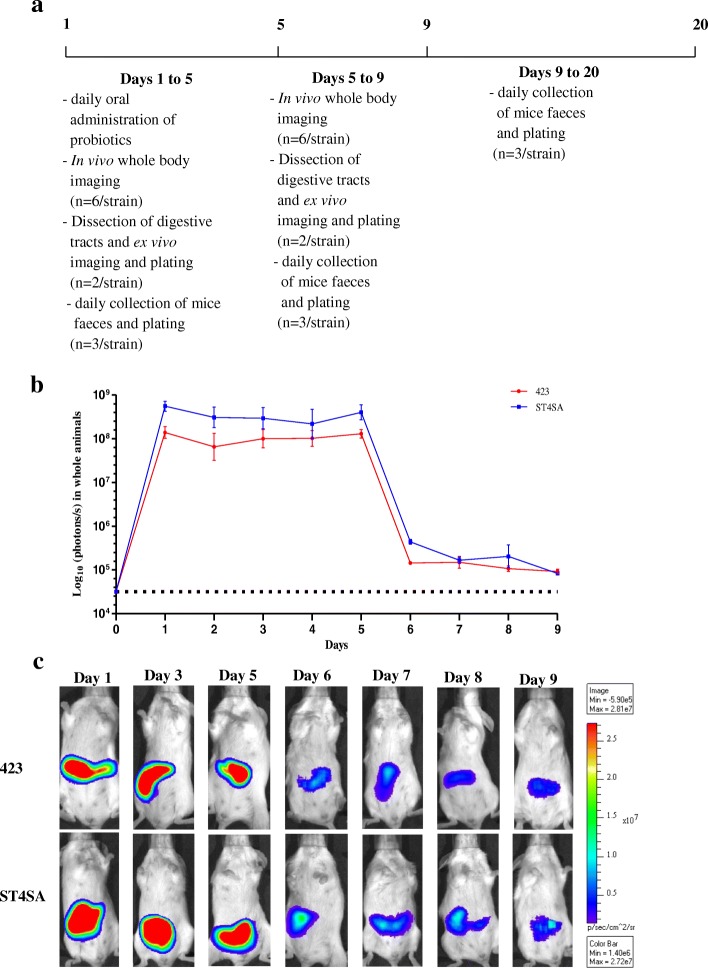
Fig. 5.
Monitoring of colonization and persistence of L. plantarum 423 and E. mundtii ST4SA in the GIT of mice by bioluminescence imaging in whole animals after five daily administrations. a The experimental design. Lactobacillus plantarum 423 Fluc and E. mundtii ST4SA Fluc were fed once daily by intragastric gavage (4 × 10⁹ CFU) to two groups of mice (n = 22, per strain) for five consecutive days (days 1 to 5). The bioluminescent signals in log10 photons/s measured in whole animals from day 1 to 9 for each set of three mice (b) are plotted, with standard deviations. No statistical differences between the bioluminescence signals of the two groups of mice were observed. The background bioluminescence signal (approximately 4 × 10⁴ p/s) emitted is represented by a dashed line. c Visual images of bioluminescence emission in whole animals by mice fed once daily for five consecutive days with L. plantarum 423 Fluc or E. mundtii ST4SA Fluc. One representative image of one mouse is shown. The intensity of the photon emission is represented as a pseudo-color image. One representative scale bar is shown (p/s)

